• Company
    • About Us
    • Case Studies
    • Press Center
    • Events
    • Careers
    • Blog
    • Contact us
  • Login
 
  • English
    • Deutsch
    • Español
    • Français
    • Italiano
    • Português
Paessler
                    - The Monitoring Experts
  • Products
    • Paessler PRTG
      Paessler PRTGMonitor your whole IT infrastructure
      • PRTG Network Monitor
      • PRTG Enterprise Monitor
      • PRTG Hosted Monitor
      • PRTG extensionsExtensions for Paessler PRTGExtend your monitoring to a new level
    • Icon Features
      FeaturesExplore all monitoring features
      • Maps & dashboards
      • Alerts & notifications
      • Multiple user interfaces
      • Distributed monitoring
      • Customizable reporting
  • Solutions
    • Industries
      IndustriesMonitor various industry sectors
      • Industrial
      • Healthcare
      • Data Center
      • Education
      • Finance
      • Government
    • IT Topics
      IT TopicsMonitor all areas of IT
      • Network Monitoring
      • Bandwidth Monitoring
      • SNMP Monitor
      • Network Mapping
      • WiFi Monitoring
      • Server Monitoring
  • Pricing
  • Resources
    • Getting Started
      Getting StartedModules for self-paced learning
    • How-to Guides
      How-to GuidesGet the most out of PRTG
    • Videos & Webinars
      Videos & WebinarsLearn from Paessler experts
    • IT  Knowledge
      IT KnowledgeExpand your IT knowledge
    • PRTG Manual
      PRTG ManualFull documentation
    • Knowledge Base
      Knowledge BaseShare community knowledge
    • PRTG Sensor Hub
      PRTG Sensor HubGet sensors, scripts & templates
    • Trainings
      PRTG TrainingLearn how to work with PRTG
  • Partners
    • icon star
      New Partners and MSPBecome a new partner or MSP
    • icon partner
      Partner PortalLog in to your partner account
    • icon search
      Find a PartnerFind partners selling Paessler products
    • icon technology
      Technology AlliancesSee Paessler technology partnerships
  • Company
    • About Us
    • Case Studies
    • Press Center
    • Events
    • Careers
    • Blog
    • Contact us
  • Login
  • English
    • Deutsch
    • Español
    • Français
    • Italiano
    • Português
  • Get a quote
  • Free trial
  1. Home>
  2. IT Topics>
  3. Application>
  4. Windows Monitoring
PRTG Logo

Windows Monitoring with PRTG

Keep a 24/7 eye on the health and performance of your Microsoft Windows systems

  • Use WMI, Windows performance counters & SNMP to monitor Windows
  • Keep an eye on Windows Event Logs and Windows security
  • Benefit from customizable sensors to fit your Windows Server monitoring needs
Free download
product overview

Our users give top ratings for monitoring with Paessler PRTG

Gartner peer insights
spiceworks
Capterra
G2
Trustpilot

PRTG Windows monitoring: What you will find on this page

Table of content
  • 5 reasons why to choose PRTG as your Windows monitoring software
  • What Windows monitoring looks like in PRTG
  • Solve Windows uptime challenges with PRTG
  • Why switch to PRTG Windows monitoring tools?
  • Explore our preconfigured PRTG sensors for Windows monitoring
  • Windows Monitoring: FAQ

PRTG makes Windows performance monitoring as easy as it gets

Custom alerts and data visualization let you quickly identify and prevent Windows network traffic and server performance issues.

Free download
PRODUCT OVERVIEW

5 reasons why to choose PRTG as your Windows monitoring software

Improve security and strive for 100% availability with these benefits.

Continuous overview of your entire Windows network

Paessler PRTG provides an all-in-one overview of your entire network, including Windows processes, system availability, databases, mail servers, web servers, virtual servers, and more.

Get peace of mind with customizable alerting that cover CPU usage, memory, disk space, and traffic, among others.

The right technology for any Windows Server version

PRTG uses Windows Management Instrumentation (WMI), Windows performance counters, or SNMP, which generates significantly lower loads for its Window server monitoring.

Our network monitor for Windows works with all the current versions of Windows Server.

Customizable features for faster troubleshooting

You can customize PRTG for monitoring numerous parameters in Windows and configure the alarm feature to receive notifications by email, SMS, push, and more, to catch specific problems as they arise.

You’ll also see valuable historical data to help you observe availability over a longer period of time, making it easier to get to the root of sudden crashes.

Built-in Windows Event Log monitoring and analysis

PRTG analyzes Windows Event Log files by default, including application and system logs.

For example, if an error occurs in the Windows operating system, a preconfigured PRTG sensor immediately sounds the alarm so you can fix the issue before it becomes business critical.

Comprehensive and reliable Windows security monitoring

PRTG retrieves security-related data (such as the status of antivirus software) in the Windows Security Center and integrates it into your monitoring overview.

You get a constant overview via your dashboard so you can even keep an eye on things even while on the go using almost any mobile device.

What Windows monitoring looks like in PRTG

Diagnose network issues by continuously tracking Microsoft Windows services like IIS, SQL servers, Windows processes, and applications like Active Directory, SharePoint, or Office 365. Show data traffic, bandwidth, memory usage, and other key performance metrics in real time. Visualize monitoring data in clear graphs and dashboards to identify problems more easily. Gain the overview you need to troubleshoot the availability, health, and performance of your entire Windows-based infrastructure.

PRTG Screenshot map Windows domain databases

Overview of Windows domain databases in PRTG

PRTG Screenshot device tree view

Device tree view of the complete monitoring setup

PRTG screenshot map entire it infrastructure

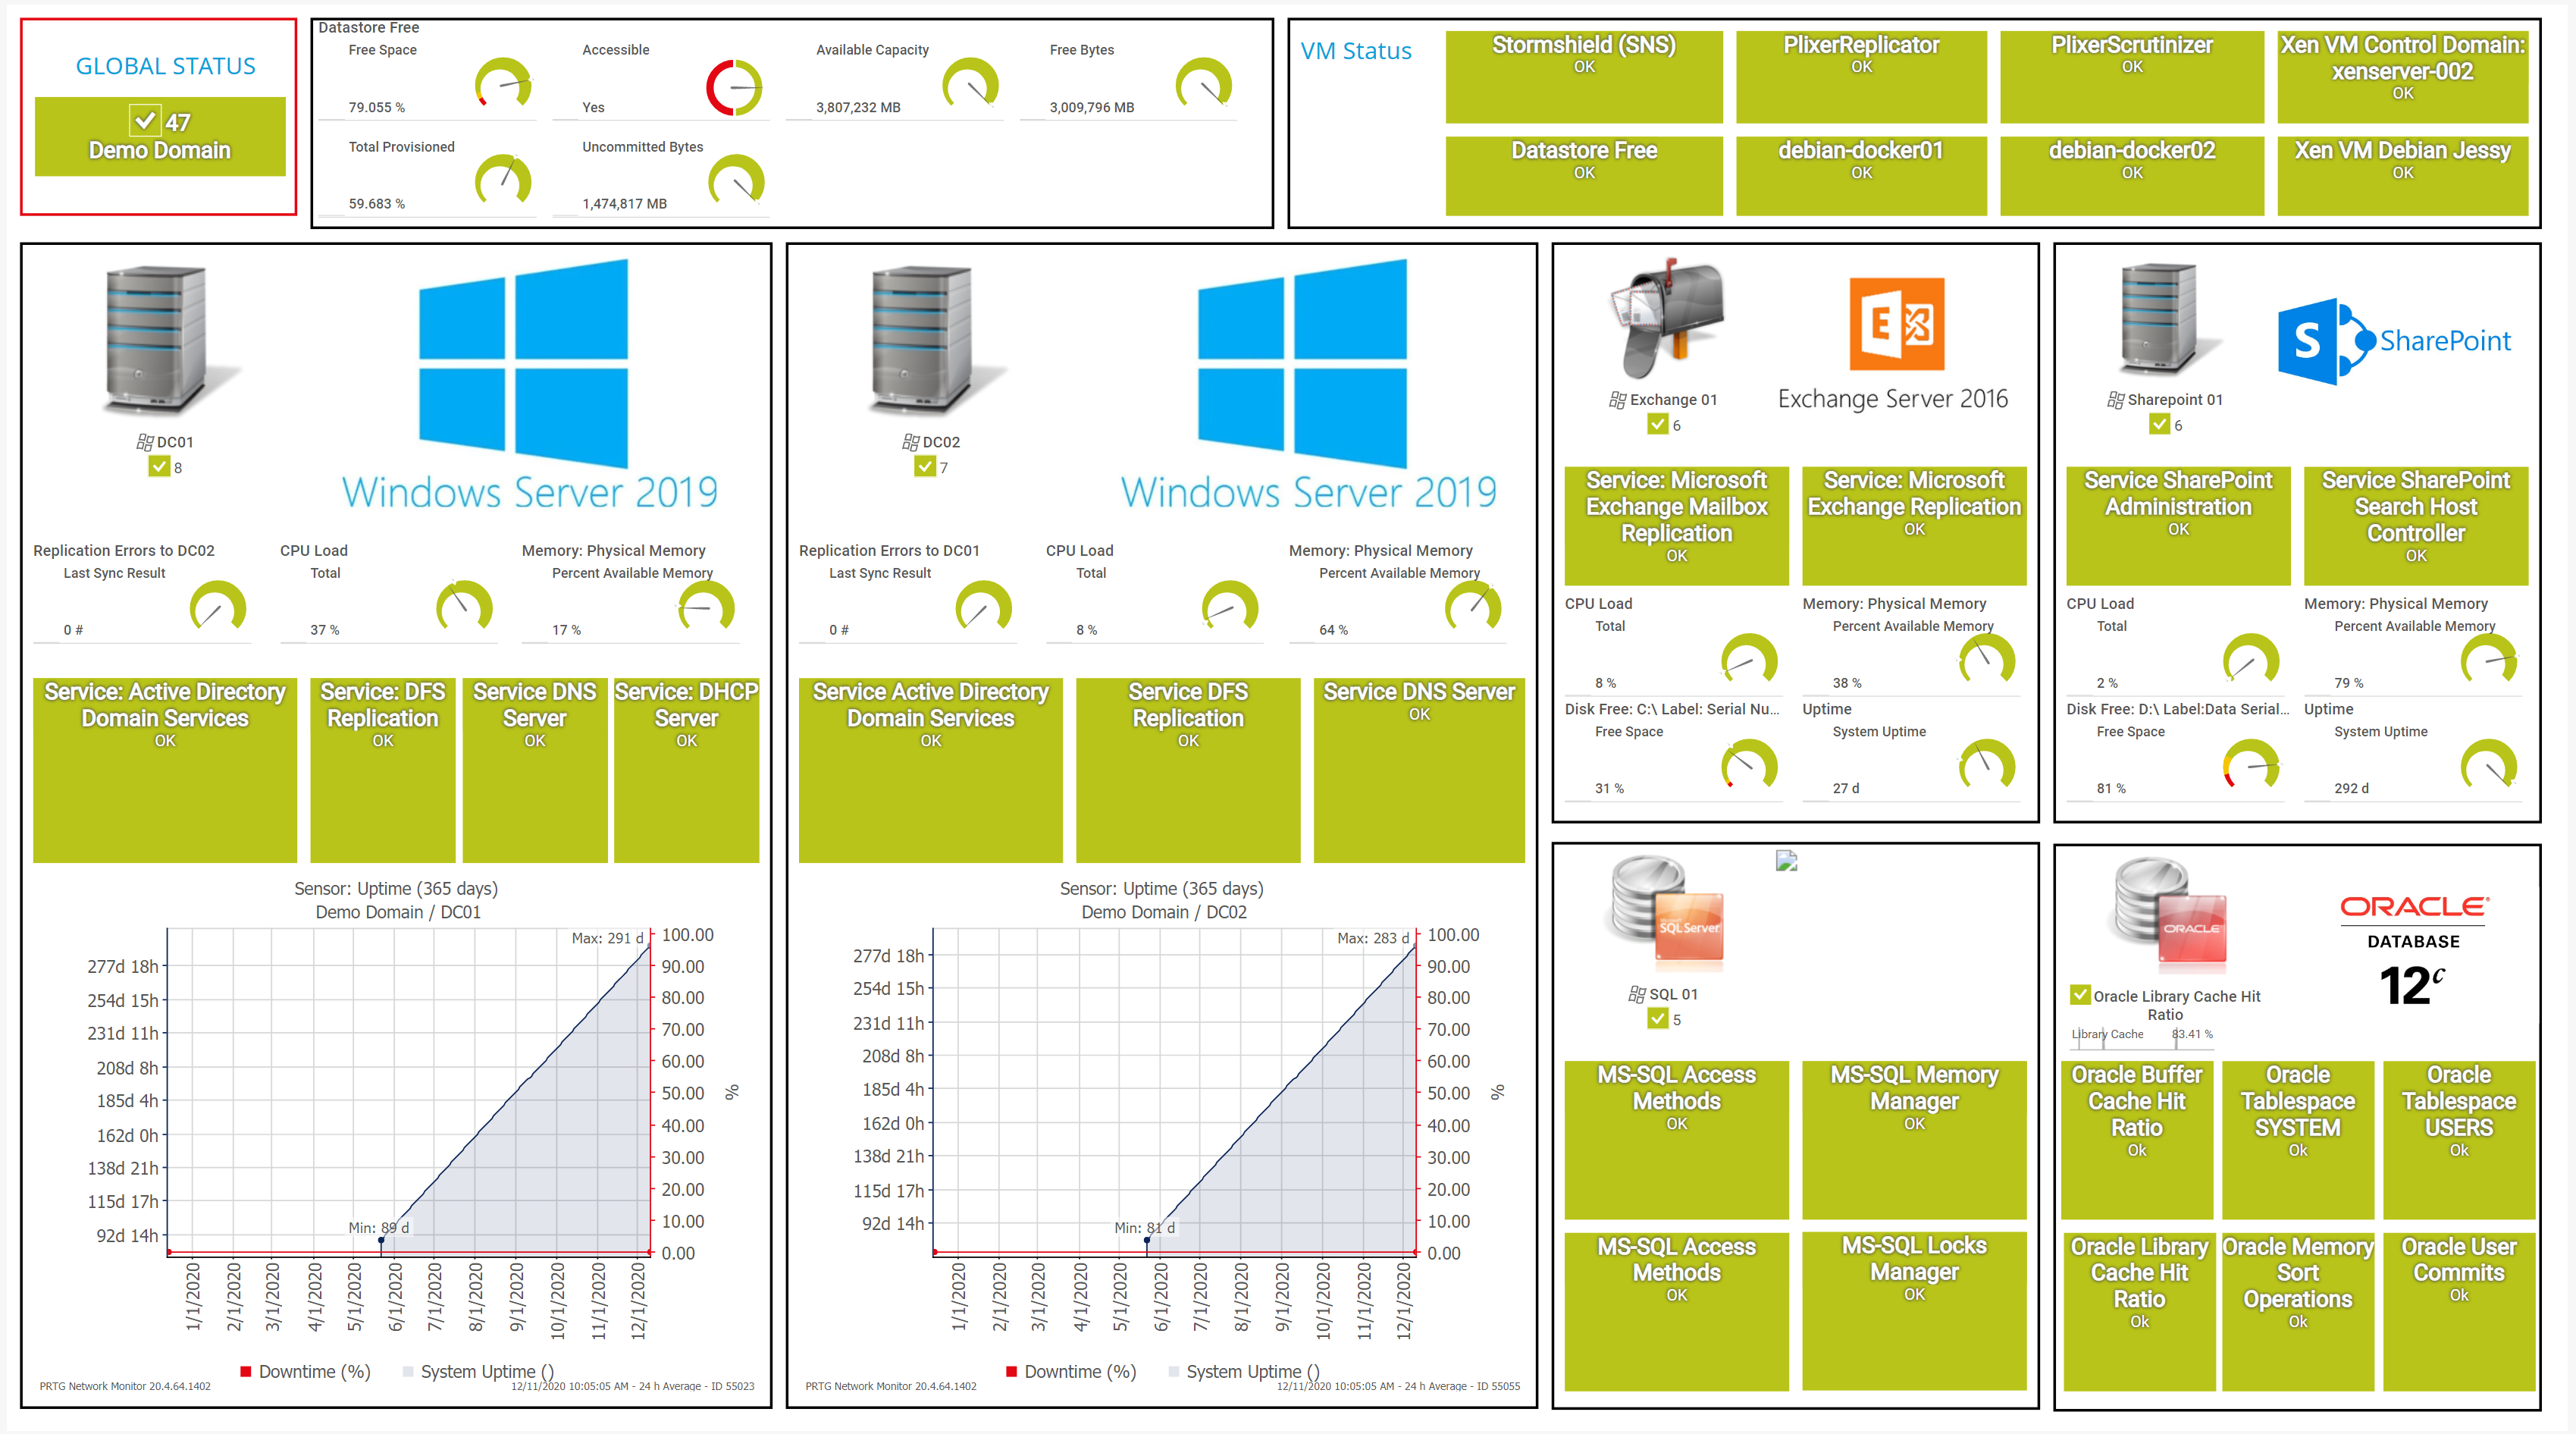
Custom PRTG dashboard for keeping an eye on the entire IT infrastructure

PRTG screenshot graph live data traffic

Live traffic data graph in PRTG

Start monitoring Windows systems with PRTG and see how it can make your network more reliable and your job easier.

Free download
PRODUCT OVERVIEW

IT experts agree: Paessler PRTG is a great solution for IT infrastructure monitoring

PCMag

“All-around winning
 network monitor”

IT Brief

“The real beauty of PRTG is the endless possibilities it offers”

ITPro

“PRTG Network Monitor 
is very hard to beat”


Solve Windows uptime challenges with PRTG

The Windows update problem

To execute pending updates in Windows systems, a reboot is usually required. As a result, the computer or server shuts down during the update and then restarts, creating downtime that can lead to applications being unavailable, causing work interruptions and even losses in sales.

Many administrators solve the “update problem” by distributing services across several servers (Windows clustering) to ensure important systems stay available during downtime, which can also occur during other situations besides updates.

check

How PRTG can help

PRTG keeps a constant eye on uptime and helps you compile comprehensive statistics. This lets you show your colleagues and higher-ups that you have a firm grip on your network, even during Windows updates.

Show Windows uptime

There are several options for viewing uptime (runtime), such as using the command line. If you enter the command “Systeminfo” into a Windows command-line tool, Windows will display the “System Boot Time,” or the date and time when the system was last rebooted.

Another option is the Task Manager’s “Performance” tab, where the CPU’s “Up Time” is displayed in days, hours, minutes, and seconds. However, these manual checks can become very tedious the larger your infrastructure is.

check

How PRTG can help

PRTG provides you with a constant overview of the uptime of your Windows systems. Gone are the days of having to check uptime manually – PRTG automatically displays it on your dashboard. In the event of a malfunction, you will immediately be notified you so you can keep downtime to a minimum.

Why switch to PRTG Windows monitoring tools?

Icon infrastructre

One centralized tool

PRTG is a comprehensive network monitoring tool that covers all your monitoring needs. You get a 24/7 global overview of your entire IT infrastructure. This means you can stop juggling separate specialized tools that offer only isolated solutions and cost precious time.

Icon test

Tried and tested solutions

PRTG offers monitoring solutions which have been tested, refined, and perfected for years. You’ll never again need to continuously program new interfaces – it’s all done already, thanks to our dedicated developer team focused entirely on PRTG.

Icon configuration

Easy configuration

Our automatic network discovery makes PRTG configuration a breeze. During setup, simply enter an IP address range and PRTG will search for available devices and add predefined sensors. This means you can get started with some initial monitoring the very first time you open the software.

Explore our preconfigured PRTG sensors for Windows monitoring

PRTG comes with more than 250 native sensor types for monitoring your entire on-premises, cloud, and hybrid cloud environment out of the box. Check out some examples below!

Windows System Uptime

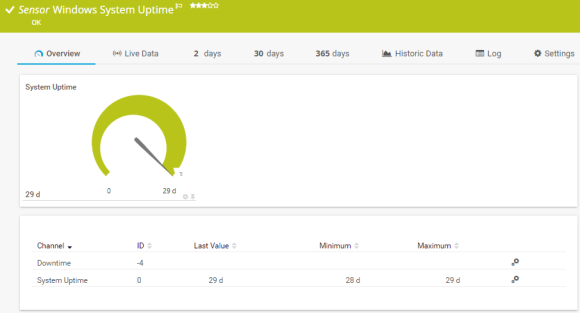
The Windows System Uptime sensor monitors the uptime of a Windows system via Windows Management Instrumentation (WMI) or Windows performance counters. It can show the following:

  • Downtime
  • System uptime
Windows System Uptime

Windows Updates Status (PowerShell)

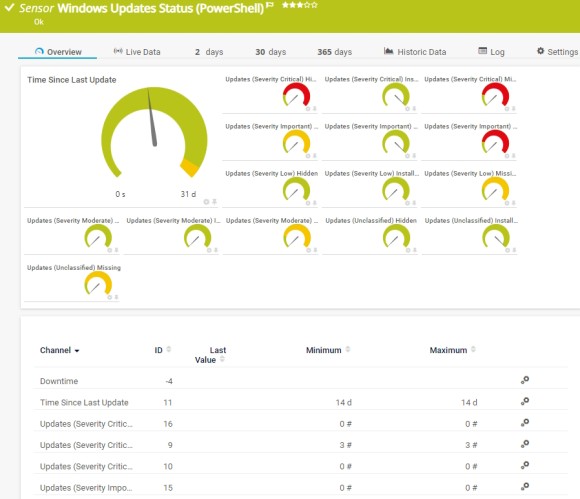
The Windows Updates Status (PowerShell) sensor monitors the status of Windows updates on a computer and counts the available and installed Windows updates that are either from Microsoft or from the local Windows Server Update Services (WSUS) server. It can show the following:

  • Time passed since the last update
  • Number of hidden, installed, and missing updates with low and moderate severity
  • Number of hidden, installed, and missing updates with unclassified severity
  • Number of hidden, installed, and missing updates with important and critical severity
Windows Updates Status (PowerShell)

WMI Event Log

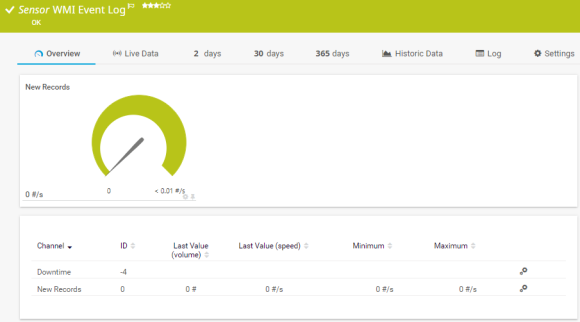
The WMI Event Log sensor monitors a Windows log file. It can show the following:

  • Downtime
  • Number of new records
WMI Event Log
WMI Event Log

WMI Security Center

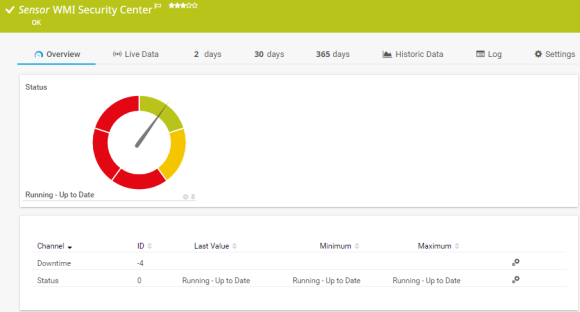
The WMI Security Center sensor monitors the security status of a Windows client system. It can monitor all security products that are controlled by Windows Security Center / Windows Action Center. It can show the following:

  • Status code of the security product
  • Downtime
WMI Security Cente
WMI Security Cente

See the PRTG Manual for a list of all available sensor types.

PRTG is compatible with all major vendors, products, and systems

compatible with all major vendors, products, and systems

PRTG makes Windows performance monitoring as easy as it gets

Custom alerts and data visualization let you quickly identify and prevent Windows network traffic and server performance issues.

Free download
PRODUCT OVERVIEW

“Since using PRTG, we have matured how we report out overall application uptime, maintenance, and mean time between failure for all critical applications to our board of directors. PRTG allows us to not just look at a single event, but to leverage historical data to prevent future failures and to measure how we are making improve­ments over time.”

Bill Sorrells, CTO
Dayton Children's Hospital

“We have found these sophisticated levels of monitoring to be highly effective, improving the end user’s experience of the systems and applications in use, giving us the opportunity to provide a proactive resolution rather than having the end user raise issues.”

Saif Akil, Head of Service Management
Acurus

“Before PRTG, applications and hardware all gave messages, but all separately, so we had to search through hundreds of e-mails to find the problem. It was always only afterwards that we saw that something was going on within the infrastructure. To mitigate the issue, we also considered other software. PRTG stood out because of its user-friendliness, flexibility and minimal consultancy investment.”

Wim Vandenberghe, ICT Manager
Soenen Golfkarton

Your Windows network monitor at a glance – even on the go

PRTG is set up in a matter of minutes and can be used on a wide variety of mobile devices.

device overview

Create innovative solutions with Paessler’s IT partners

Partnering with innovative IT vendors, Paessler unleashes synergies to create
new and additional benefits for joined customers.

IP Fabric

IP Fabric

Combining PRTG’s broad monitoring feature set with IP Fabric’s automated network assurance creates a new level of network visibility and reliability.

Read more
KnowledgeRiver

KnowledgeRiver

Combining their tools to a powerful solution for advanced analysis and automation, KnowledgeRiver and Paessler enable IT teams to ensure best performance for their infrastructure and networks.

Read more
ScriptRunner

ScriptRunner

With ScriptRunner Paessler integrates a powerful event automation platform into PRTG Network Monitor.

Read more
Paessler PRTG

Paessler PRTG

Network Monitoring Software – Version 24.4.102.1351 (November 12th, 2024)

Hosting icon

Hosting

Download for Windows and cloud-based version PRTG Hosted Monitor available

Languages icon

Languages

English, German, Spanish, French, Portuguese, Dutch, Russian, Japanese, and Simplified Chinese

test

Monitor everything

Network devices, bandwidth, servers, applications, virtual environments, remote systems, IoT, and more

test

Pricing

Choose the PRTG Network Monitor subscription that's best for you

Discover more monitoring insights and stories

Resources Solution

Solutions for all your monitoring needs

  • PRTG Microsoft server monitoring
  • Comprehensive Windows service monitoring
  • Operating System Monitoring
Resources Content

Powerful stories from the monitoring world

  • How to enable SNMP on your operating system
  • Monitoring Windows DHCP
  • Monitoring Microsoft Direct Access
Resources Solutions

Resources to master your monitoring challenges

  • Monitoring standalone Windows Server 2008 R2 64-bit Edition
  • Monitor Windows Server Backup
  • Anybody monitoring DNS request/sec on a Windows Server?

Windows Monitoring: FAQ


What is Windows monitoring?

Windows monitoring refers to the continuous observation and analysis of the performance, health, and activities of a Windows operating system. It involves tracking key metrics such as CPU usage, memory consumption, disk activity, and network traffic to identify potential issues or bottlenecks. This process is crucial for maintaining a reliable and efficient computing environment, as well as the overall stability and security of the Windows environment in both personal and enterprise settings.

Why should I monitor Windows operating systems?

Monitoring Windows operating systems is essential for several reasons. Firstly, it helps identify and address performance issues, ensuring optimal system efficiency. Secondly, it enables early detection of potential security threats or unauthorized activities, enhancing overall system security. Thirdly, monitoring assists in capacity planning by tracking resource usage trends and predicting future requirements. Additionally, it aids in troubleshooting and resolving problems promptly, minimizing downtime and optimizing user experience.

Which Windows Server versions can I monitor with PRTG?

PRTG is designed to monitor the following Windows Server versions:

  • Windows Server 2016
  • Windows Server 2019
  • Windows Server 2022
Can I only monitor Windows systems with PRTG?

No. With PRTG, you can keep an eye on all kinds of operating systems, including Linux/Unix and macOS.

What is a sensor in PRTG?

In PRTG, “sensors” are the basic monitoring elements. One sensor usually monitors one measured value in your network, for example the traffic of a switch port, the CPU load of a server, or the free space on a disk drive. On average, you need about 5-10 sensors per device or one sensor per switch port.

We asked: would you recommend PRTG? Over 95% of our customers say yes!

Paessler conducted trials in over 600 IT departments worldwide to tune its network monitoring software closer to the needs of sysadmins. The result of the survey: over 95% of the participants would recommend PRTG – or already have.

recommendation

Still not convinced?

Love

More than 500,000 sysadmins love PRTG

Paessler PRTG is used by companies of all sizes. Sysadmins love PRTG because it makes their job a whole lot easier.

PRTG

Monitor your entire IT infrastructure

Bandwidth, servers, virtual environments, websites, VoIP services – PRTG keeps an eye on your entire network.

test

Try Paessler PRTG for free

Everyone has different monitoring needs. That’s why we let you try PRTG for free.

PRTG Logo

Start Windows monitoring with PRTG and see how it can make your network more reliable and your job easier.

Free download
PRODUCT OVERVIEW

Products

  • Paessler PRTG
    Paessler PRTGMonitor your whole IT infrastructure
    • PRTG Network Monitor
    • PRTG Enterprise Monitor
    • PRTG Hosted Monitor
  • PRTG extensions
    Extensions for Paessler PRTGExtend your monitoring to a new level
  • Icon Features
    FeaturesExplore all monitoring features

Monitoring with PRTG

  • Network monitoring
  • Bandwidth monitoring
  • SNMP monitoring
  • Network mapping
  • Wi-Fi monitoring
  • Server monitoring
  • Network traffic analyzer
  • NetFlow monitoring
  • Syslog server

Useful Links

  • PRTG Manual
  • Knowledge Base
  • Customer Success Stories
  • About Paessler
  • Subscribe to newsletter
  • PRTG Support
  • PRTG Consulting

Contact

Paessler GmbH
Thurn-und-Taxis-Str. 14, 
90411 Nuremberg 
Germany

[email protected]

+49 911 93775-0

  • Contact us
©2025 Paessler GmbHTerms & ConditionsPrivacy PolicyImprintReport VulnerabilityDownload & InstallSitemap
CPU Monitoring Tool CPU Monitoring Tool CPU Monitoring Tool