• Company
    • About Us
    • Case Studies
    • Press Center
    • Events
    • Careers
    • Blog
    • Contact us
  • Login
 
  • English
    • Deutsch
    • Español
    • Français
    • Italiano
    • Português
Paessler
                    - The Monitoring Experts
  • Products
    • Paessler PRTG
      Paessler PRTGMonitor your whole IT infrastructure
      • PRTG Network Monitor
      • PRTG Enterprise Monitor
      • PRTG Hosted Monitor
      • PRTG extensionsExtensions for Paessler PRTGExtend your monitoring to a new level
    • Icon Features
      FeaturesExplore all monitoring features
      • Maps & dashboards
      • Alerts & notifications
      • Multiple user interfaces
      • Distributed monitoring
      • Customizable reporting
  • Solutions
    • Industries
      IndustriesMonitor various industry sectors
      • Industrial
      • Healthcare
      • Data Center
      • Education
      • Finance
      • Government
    • IT Topics
      IT TopicsMonitor all areas of IT
      • Network Monitoring
      • Bandwidth Monitoring
      • SNMP Monitor
      • Network Mapping
      • WiFi Monitoring
      • Server Monitoring
  • Pricing
  • Resources
    • Getting Started
      Getting StartedModules for self-paced learning
    • How-to Guides
      How-to GuidesGet the most out of PRTG
    • Videos & Webinars
      Videos & WebinarsLearn from Paessler experts
    • IT  Knowledge
      IT KnowledgeExpand your IT knowledge
    • PRTG Manual
      PRTG ManualFull documentation
    • Knowledge Base
      Knowledge BaseShare community knowledge
    • PRTG Sensor Hub
      PRTG Sensor HubGet sensors, scripts & templates
    • Trainings
      PRTG TrainingLearn how to work with PRTG
  • Partners
    • icon star
      New Partners and MSPBecome a new partner or MSP
    • icon partner
      Partner PortalLog in to your partner account
    • icon search
      Find a PartnerFind partners selling Paessler products
    • icon technology
      Technology AlliancesSee Paessler technology partnerships
  • Company
    • About Us
    • Case Studies
    • Press Center
    • Events
    • Careers
    • Blog
    • Contact us
  • Login
  • English
    • Deutsch
    • Español
    • Français
    • Italiano
    • Português
  • Get a quote
  • Free trial
  1. Home>
  2. IT Topics>
  3. Network>
  4. URL Monitoring
PRTG Logo

URL Monitoring with PRTG

Keep a constant eye on website performance and uptime

  • Monitor the response time and reachability of URLs
  • Monitor entire websites or individual elements only
  • Be notified quickly by customizable alarms
Free download
product overview

Our users give top ratings for monitoring with Paessler PRTG

Gartner peer insights
spiceworks
Capterra
G2
Trustpilot

PRTG URL monitoring: What you will find on this page

Table of content
  • How our URL monitoring tool keeps an eye on your website
  • What URL monitoring looks like in PRTG
  • 3 reasons to choose PRTG as your URL monitoring service
  • Discover URL monitoring sensors included with PRTG
  • Monitor URLs: FAQ

PRTG makes URL monitoring as easy as it gets

Custom alerts and data visualization let you quickly identify and prevent website availability, URL redirection, IP address resolution, and permissions management issues.

Free download
PRODUCT OVERVIEW

How our URL monitoring tool keeps an eye on your website

check

24/7 monitoring of all your URLs

With PRTG URL monitoring, you can check the reachability of your websites at any time 24/7. It lets you immediately see if a page is up and its processes running.

You can even add and monitor several different pages – or an entire list of URLs – with a few quick clicks.

check

Availability & response time checks

PRTG automatically verifies the availability of entire pages or individual elements (such as text or images). At the same time, PRTG measures response times and displays this information in long-term graphs. If your website goes offline or a response time exceeds its limit, you’ll immediately be alerted via SMS, email, push notification, or other methods.

What URL monitoring looks like in PRTG

Diagnose network issues by continuously tracking the loading times and availability of your web pages. Show response time, web application integration, status codes, website processes, and other key website monitoring metrics in real time. Visualize monitoring data in clear graphs and custom HTML dashboards to identify problems more easily. Gain the overview you need to troubleshoot all kinds of issues with your web and online presentation.

PRTG Screenshot device tree view

Device tree view of the complete monitoring setup

PRTG screenshot map entire it infrastructure

Custom PRTG dashboard for keeping an eye on the entire IT infrastructure

PRTG screenshot graph live data traffic

Live traffic data graph in PRTG

website monitoring

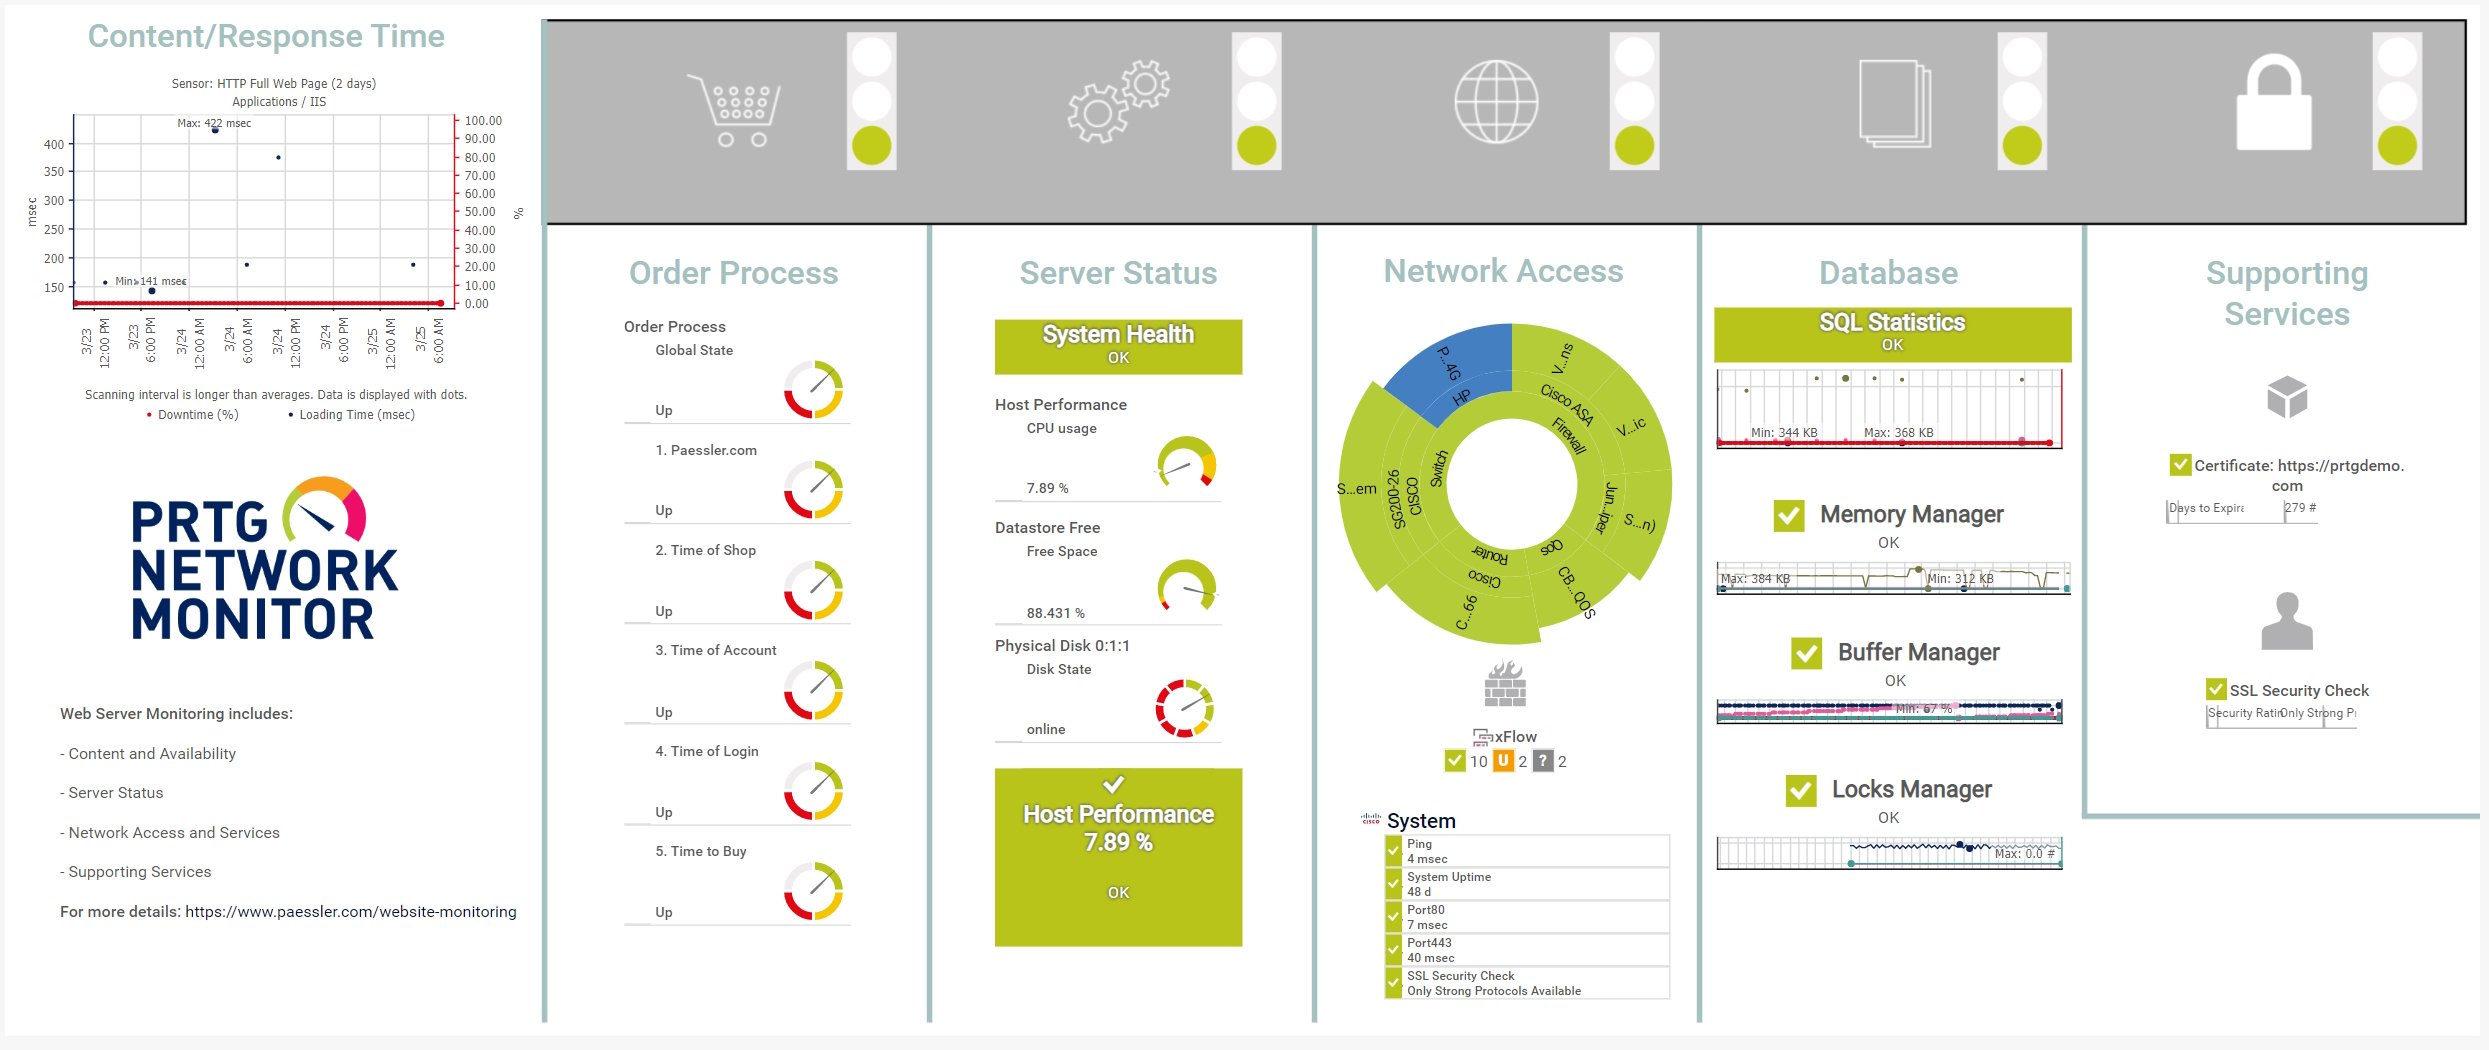
Web Server Monitoring with PRTG


Start URL performance monitoring with PRTG and see how it can make your network more reliable and your job easier.

Free download
PRODUCT OVERVIEW

IT experts agree: Paessler PRTG is a great solution for IT infrastructure monitoring

PCMag

“All-around winning
 network monitor”

IT Brief

“The real beauty of PRTG is the endless possibilities it offers”

ITPro

“PRTG Network Monitor 
is very hard to beat”

3 reasons to choose PRTG as your URL monitoring service

Icon Boost

Faster troubleshooting

Determining why your URLs are unreachable can be tricky, but PRTG makes it easy. It not only lets you keep an eye on the uptime and performance of your pages, but also the web and network components that ensure your site stays functional: databases, servers, CDNs, and applications. With PRTG, you'll spend a lot less time troubleshooting.

Icon Alarm

Prompt, customizable alerts

PRTG’s customizable notification system is simple: you set a custom warning or error threshold value for every parameter you wish to monitor. If this value is exceeded, PRTG will immediately send you an alert however you want, such as by email, SMS, or in-app push notification – our free mobile apps for iOS and Android grant you worldwide access to your network monitoring environment.

test

Automated reports

PRTG automatically logs the reachability of your URLs and the performance of your website. For example, you can have monthly PDF monitoring summaries automatically sent to your manager. These summaries come in handy when you’re asked to justify a request to update the IT infrastructure.

Explore our preconfigured PRTG sensors for network activity monitoring

PRTG comes with more than 250 native sensor types for monitoring your entire on-premises, cloud, and hybrid cloud environment out of the box. Check out some examples below!

HTTP v2

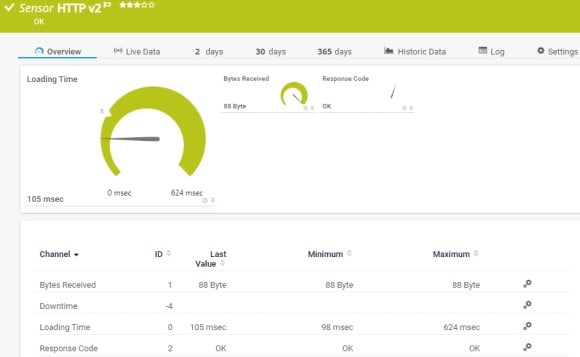
The HTTP v2 sensor monitors a web server. It can show the following:

  • Number of bytes received
  • Web page or element loading time
  • Response code of the target server
HTTP v2
HTTP v2

HTTP Full Web Page

The HTTP Full Web Page sensor monitors the full download time of a web page including assets such as images. In the background, it opens the web page in a browser instance to perform the measurement. It can show the following:

  • Downtime
  • Loading time of the full web page
HTTP Full Web Page
HTTP Full Web Page

SSL Certificate

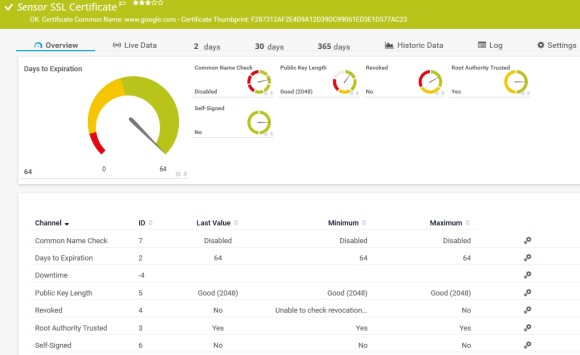
The SSL Certificate sensor monitors the certificate of a Secure Sockets Layer (SSL)/Transport Layer Security (TLS) secured connection. It can show the following:

  • If the common name or subject-alternative names match the host address or SNI
  • Days to expiration
  • Public key length
  • If the certificate has been revoked and if it is trusted as root authority
  • If a self-signed certificate is used
SSL Certificate
SSL Certificate

SSL Security Check

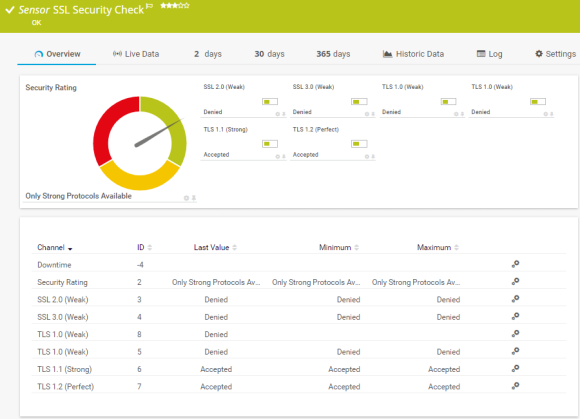
The SSL Security Check sensor monitors Secure Sockets Layer (SSL)/Transport Layer Security (TLS) connectivity to the port of a device. It tries to connect to the specified TCP/IP port number of a device with different SSL/TLS versions and shows if the device supports a particular protocol. It can show the following:

  • Security of the connection to the defined port
  • Status of connections using SSL v3, TLS 1.0, TLS 1.1, TLS 1.2, and TLS 1.3
SSL Security Check
SSL Security Check

See the PRTG Manual for a list of all available sensor types.

PRTG is compatible with all major vendors, products, and systems

compatible with all major vendors, products, and systems

Find the root cause of the problem with our PRTG URL monitoring solution

Real-time notifications mean faster troubleshooting so that you can act before more serious issues occur.

Free download
PRODUCT OVERVIEW

”Adopting PRTG has been like going from being in the dark to being in the light. Before, we had limited visibility into what was happening in the infrastructure and in the network. Now, however, thanks to the comprehensive dashboard and real-time notifications, we receive constant updates on the status of facilities and services, and our way of working has gone from passive to proactive.”

Luca Meneghesso, Senior IT infrastructure and Security Specialist
Banca Profilo

”GESAC increasingly focuses on innovation to improve the quality of services offered and the experience of passengers handled every day by Naples Airport. Thanks to PRTG, we finally have unified, automatic, and continuous monitoring of the airport network and can guarantee quick and timely interventions.”

Domenico Ciervo, GESAC ICT Manager
Naples International Airport

”As an international company, PRTG is ideal for us. If something went down half way across the world, we wouldn’t be woken up – we can rely on PRTG to identify the problem and alert us before it occurs – enabling the right person, in the right time zone to resolve the problem. At the end of the day, if we’re to provide an internal network experience for our employees that meets expectations, we need a tool like PRTG to be successful.”

Barry Kelly, Systems Engineer
Skyscanner

“I would recommend PRTG because it has helped us significantly improve service uptime by highlighting important alerts that would otherwise result in a system failure or service disruption if action was not taken. Thanks to PRTG, we can ensure that The Ritz London’s network and IT systems are five-star, just like the hotel.”

Richard Isted, IT Manager
The Ritz London

Your URL monitor at a glance – even on the go

PRTG is set up in a matter of minutes and can be used on a wide variety of mobile devices.

device overview
Gartner peer insights

“Excellent tool for detailed monitoring. Alarms and notifications work greatly. Equipment addition is straight forward and server initial setup is very easy. ...feel safe to purchase it if you intend to monitor a large networking landscape.”

Read the complete review at Gartner Peer Insights

Create innovative solutions with Paessler’s IT partners

Partnering with innovative IT vendors, Paessler unleashes synergies to create
new and additional benefits for joined customers.

IP Fabric

IP Fabric

Combining PRTG’s broad monitoring feature set with IP Fabric’s automated network assurance creates a new level of network visibility and reliability.

Read more
Osirium

Osirium

Osirium’s experienced management team has an outstanding track record in cybersecurity and automation, establishing its headquarters near Reading, UK.

Read more
Plixer

Plixer

Paessler and Plixer provide a complete solution adding flow and metadata analysis to a powerful network monitoring tool.

Read more

Find the root cause of the problem with our PRTG URL monitoring solution

Real-time notifications mean faster troubleshooting so that you can act before more serious issues occur.

Free download
PRODUCT OVERVIEW
Paessler PRTG

Paessler PRTG

Network Monitoring Software – Version 24.4.102.1351 (November 12th, 2024)

Hosting icon

Hosting

Download for Windows and cloud-based version PRTG Hosted Monitor available

Languages icon

Languages

English, German, Spanish, French, Portuguese, Dutch, Russian, Japanese, and Simplified Chinese

test

Monitor everything

Network devices, bandwidth, servers, applications, virtual environments, remote systems, IoT, and more

test

Pricing

Choose the PRTG Network Monitor subscription that's best for you

Discover more monitoring insights and stories

Resources Solution

Solutions for all your monitoring needs

  • HTTP monitoring
  • Website monitoring
  • Monitor your clients' transactions with the PRTG HTTP/S transaction monitoring tool
Resources Content

Powerful stories from the monitoring world

  • Introducing the PRTG Network Monitor API
  • Get alerted about data center outages with Microsoft Teams
  • Simplifying diabetes management
Resources Solutions

Resources to master your monitoring challenges

  • Monitoring via HTTP
  • Monitor URL that doesn't have html or xml tags
  • Is there a variable for Service URL?

URL Monitoring: FAQ


What is a URL?

A URL, or Uniform Resource Locator, is the address used to access resources on the internet. It specifies the location of a resource, such as a web page, an image, or a file, and the protocol used to retrieve it.

What is URL monitoring?

URL monitoring is the process of regularly checking the availability and performance of a website or web resource. This involves automated URL monitoring tools like Paessler PRTG that ping the URL to ensure it is accessible and measure metrics like response time and uptime. URL monitoring helps detect and address issues promptly, ensuring reliable access for users. It is crucial for maintaining website functionality and best user experience.

Why is URL monitoring important?
  • Performance is a must: For most companies, the website is an indispensable part of their daily business. Not only must the website always be available, but it should also be optimized to function at as high a level as possible. Downtime or long load times can be extremely costly.
  • The company website as a direct (or indirect) source of revenue: Even without an online store to generate sales directly, your website serves as an indirect source of revenue by providing customers with information about your company and the ways to access your services.
  • Consequences of a poorly functioning website: If the URL of your online store is unavailable for several hours, this can result in an immediate and palpable loss in sales. When a web page takes too long to load, many users will simply give up and surf to another site. This, too, can have a negative impact on your company’s revenue.
How does PRTG monitor URLs?

To monitor URLs using PRTG, follow these steps:

  1. Add a sensor: Log in to the PRTG web interface and navigate to the device where you want to add the URL monitoring sensor.
  2. Select a sensor type: Choose the HTTP sensor type you want to use, such as the HTTP v2 or HTTP Full Web Page
  3. Configure the URL: Enter the URL you want to monitor in the sensor settings. You can specify additional parameters like request type (GET/POST), authentication, and SSL settings if needed.
  4. Set thresholds: Define parameters for monitoring such as response time thresholds, content checks (like specific keywords), and frequency of checks.
  5. Save and test: Save the sensor configuration and test it to ensure it correctly monitors the specified URL. PRTG will now regularly check the URL and provide alerts based on the configured parameters.

This setup helps ensure continuous monitoring and alerts for any downtime or performance issues.

What is a sensor in PRTG?

In PRTG, “sensors” are the basic monitoring elements. One sensor usually monitors one measured value in your network, for example the traffic of a switch port, the CPU load of a server, or the free space on a disk drive. On average, you need about 5-10 sensors per device or one sensor per switch port.

We asked: would you recommend PRTG? Over 95% of our customers say yes!

Paessler conducted trials in over 600 IT departments worldwide to tune its network monitoring software closer to the needs of sysadmins. The result of the survey: over 95% of the participants would recommend PRTG – or already have.

recommendation

Still not convinced?

Love

More than 500,000 sysadmins love PRTG

Paessler PRTG is used by companies of all sizes. Sysadmins love PRTG because it makes their job a whole lot easier.

PRTG

Monitor your entire IT infrastructure

Bandwidth, servers, virtual environments, websites, VoIP services – PRTG keeps an eye on your entire network.

test

Try Paessler PRTG for free

Everyone has different monitoring needs. That’s why we let you try PRTG for free.

PRTG Logo

Start monitoring network activity with PRTG and see how it can make your network more reliable and your job easier.

Free download
PRODUCT OVERVIEW

Products

  • Paessler PRTG
    Paessler PRTGMonitor your whole IT infrastructure
    • PRTG Network Monitor
    • PRTG Enterprise Monitor
    • PRTG Hosted Monitor
  • PRTG extensions
    Extensions for Paessler PRTGExtend your monitoring to a new level
  • Icon Features
    FeaturesExplore all monitoring features

Monitoring with PRTG

  • Network monitoring
  • Bandwidth monitoring
  • SNMP monitoring
  • Network mapping
  • Wi-Fi monitoring
  • Server monitoring
  • Network traffic analyzer
  • NetFlow monitoring
  • Syslog server

Useful Links

  • PRTG Manual
  • Knowledge Base
  • Customer Success Stories
  • About Paessler
  • Subscribe to newsletter
  • PRTG Support
  • PRTG Consulting

Contact

Paessler GmbH
Thurn-und-Taxis-Str. 14, 
90411 Nuremberg 
Germany

[email protected]

+49 911 93775-0

  • Contact us
©2025 Paessler GmbHTerms & ConditionsPrivacy PolicyImprintReport VulnerabilityDownload & InstallSitemap
Ping Monitoring Ping Monitoring Ping Monitoring