Custom alerts and data visualization let you quickly identify and prevent network health and performance issues.
Are you a system administrator in charge of a macOS or mixed-OS network and prefer to deal with Windows systems as little as possible? Then we have good news for you!
Paessler PRTG is a powerful network monitoring tool for Mac that lets you monitor your network’s performance from a single dashboard. This gives you 24/7 control and increases your ability to spot and resolve issues faster than ever before.
PRTG is primarily Windows-based, so you need a Windows server as the central PRTG server. But with the functionality of our new, included multi-platform probe, you can monitor your whole network from Mac.
Just install the probe on your macOS system and enjoy the flexibility of managing your PRTG monitoring environment without needing Windows – and without paying extra.
If you are looking for a simple way to visualize monitoring data with light management features, our free PRTG app for desktop is a great choice. It’s easy to set up and lets you connect to all your PRTG instances directly from your Mac.
This allows you to access everything you need from one place, whether you are using PRTG on-premises or our cloud-based solution.
Diagnose network issues by continuously tracking the availability, health, and performance of your entire IT infrastructure. Show network traffic, bandwidth usage, hardware status, response time and other key metrics in real time. Visualize monitoring data in clear graphs and dashboards to identify problems more easily. Gain the overview you need to troubleshoot all kinds of issues from your Mac operating system.

Device tree view of the complete monitoring setup
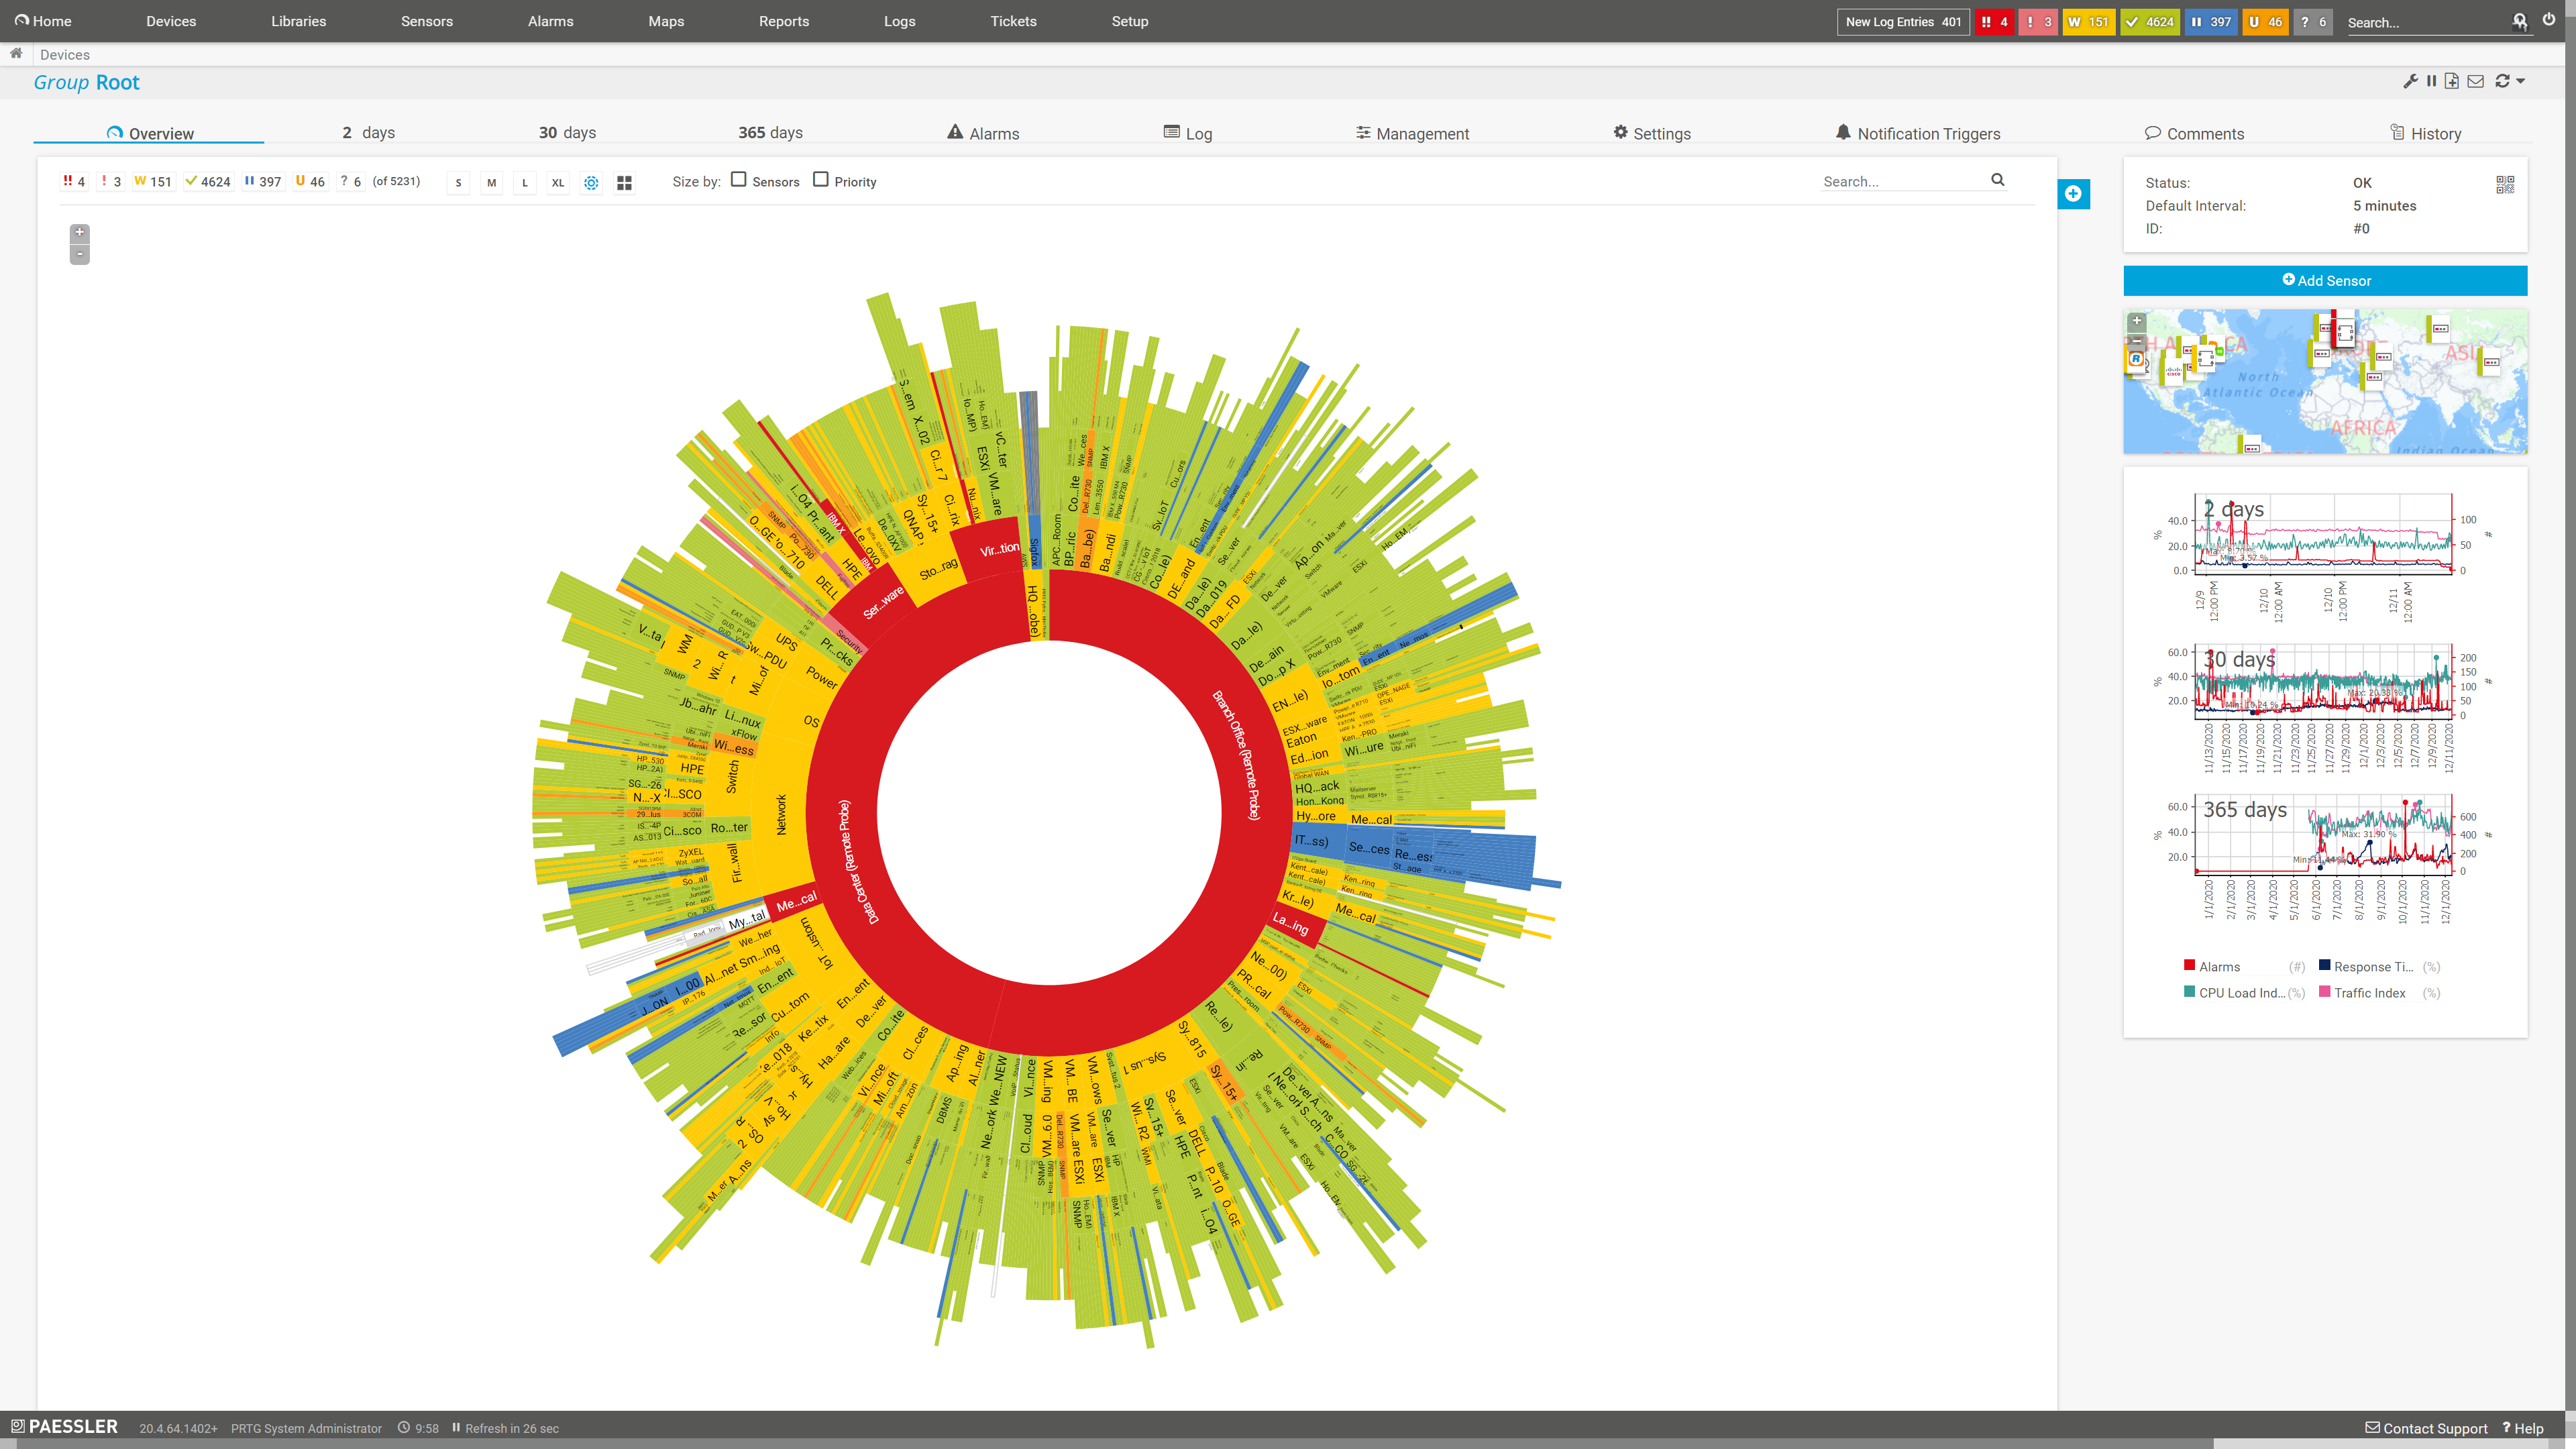
Sunburst view in the PRTG app for desktop

Custom PRTG dashboard for keeping an eye on the entire IT infrastructure
“All-around winning
network monitor”
“The real beauty of PRTG is the endless possibilities it offers”
“PRTG Network Monitor
is very hard to beat”
Using PRTG on Mac (formerly known as OSX network monitor) just marks the beginning of your journey with PRTG. With the completely free and easy-to-set-up multi-platform probe, you can monitor macOS, Windows, and different Linux distributions like Ubuntu or RHEL.
A perfect fit for hybrid environments. And if you want a completely Windows-free experience, our SaaS solution PRTG Hosted Monitor might be just right for you.
Choose your preferred warning and error thresholds, and PRTG will let you know the second your network is at risk of breaching them.
This way, you can fix problems before they cause major disruptions. You can also choose various notification methods that you can configure according to your needs. Get alerted by SMS, email, or push notification via the PRTG app for iOS – whatever you prefer.
A complete overview of all your Mac devices and your entire IT environment, right at your fingertips. If you need to check real-time server capacity or how the average load of all your systems has fluctuated over time, PRTG makes it quick and easy.
Enjoy the intuitive management of your device tree, editing multiple monitoring objects at once, or generating in-depth reports – all from a single pane of glass.
Nobody wants to spend multiple hours setting up a monitoring environment. That’s why PRTG is designed to be up and running in a matter of minutes.
You’ll get useful out-of-the-box settings, network mapping, as well as our convenient auto-discovery function, which will get everything set up in just a few clicks. Afterwards you can start fine-tuning, knowing that everything is already being monitored.
PRTG comes with more than 250 native sensor types for monitoring your entire on-premises, cloud, and hybrid cloud environment out of the box. Check out some examples below!
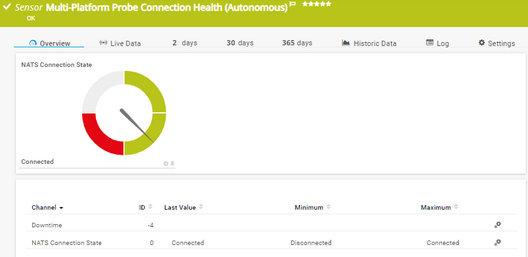
The Multi-Platform Probe Connection Health (Autonomous) sensor monitors the status of the connection between the PRTG core and multi-platform probes. It can show the following:
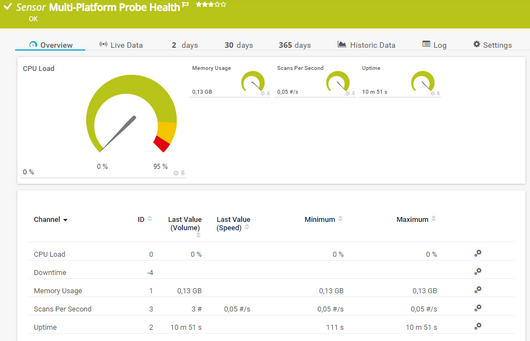
The Multi-Platform Probe Health sensor monitors the status of a multi-platform probe device. It can show the following:
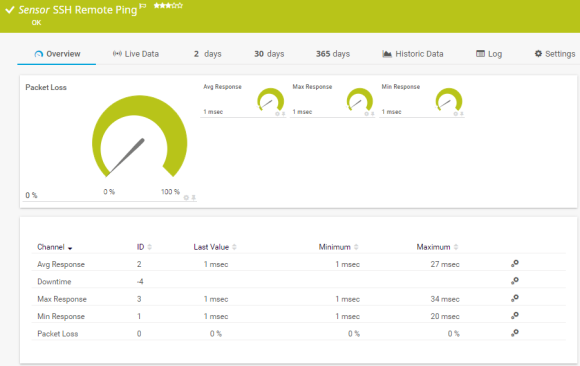
The SSH Remote Ping sensor remotely monitors the connectivity between a system running Linux/macOS X and another device, using Internet Control Message Protocol (ICMP) echo requests ("ping") and Secure Shell (SSH). It can show the following:
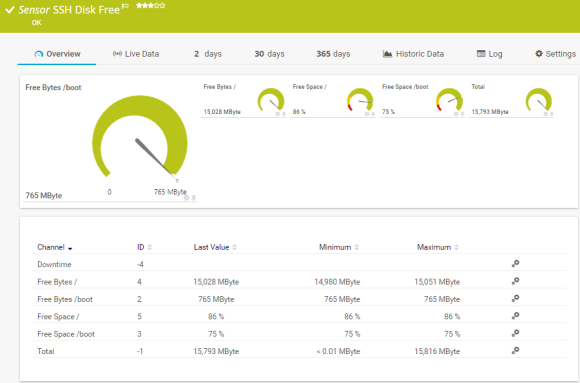
The SSH Disk Free sensor monitors the free space on disks of a Linux/Unix system using Secure Shell (SSH). It can show the following:
See the PRTG Manual for a list of all available sensor types.

Custom alerts and data visualization let you quickly identify and prevent performance and network health issues.
PRTG is set up in a matter of minutes and can be used on a wide variety of mobile devices.

Partnering with innovative IT vendors, Paessler unleashes synergies to create
new and additional benefits for joined customers.

Combining their tools to a powerful solution for advanced analysis and automation, KnowledgeRiver and Paessler enable IT teams to ensure best performance for their infrastructure and networks.

UVexplorer integrates tightly with PRTG to bring fast and accurate network discovery, detailed device inventory, and automatic network mapping to the PRTG platform.

With ScriptRunner Paessler integrates a powerful event automation platform into PRTG Network Monitor.
Real-time notifications mean faster troubleshooting so that you can act before more serious issues occur.
Network Monitoring Software – Version 24.4.102.1351 (November 12th, 2024)
Download for Windows and cloud-based version PRTG Hosted Monitor available
English, German, Spanish, French, Portuguese, Dutch, Russian, Japanese, and Simplified Chinese
Network devices, bandwidth, servers, applications, virtual environments, remote systems, IoT, and more
Choose the PRTG Network Monitor subscription that's best for you
Right now, the answer is no. The PRTG core server is Windows-only, but you can use the PRTG app for desktop or the multi-platform probe on macOS to monitor everything from your Mac. You can also use PRTG Hosted Monitor for a cloud-based option if you want to avoid a Windows installation.
Yes, but we highly recommend using a dedicated physical server for the best performance, especially when you're planning to run a lot of sensors.
Yes, absolutely! PRTG can monitor macOS using SNMP and SSH sensor types to keep track of key metrics.
WMI is mainly used for monitoring Windows devices, but PRTG has a great Knowledge Base that can help you with topics like setting up firewalls and using other monitoring methods like SNMP and SSH for macOS environments. You can easily find templates and setup guides for common configurations.
PRTG offers great support options. These include a detailed Knowledge Base, pre-built sensor and device templates and scripts, manuals, and setup guides which are especially useful for mixed OS environments, including macOS and Microsoft systems.
In PRTG, “sensors” are the basic monitoring elements. One sensor usually monitors one measured value in your network, for example the traffic of a switch port, the CPU load of a server, or the free space on a disk drive. On average, you need about 5-10 sensors per device or one sensor per switch port.
Paessler conducted trials in over 600 IT departments worldwide to tune its network monitoring software closer to the needs of sysadmins. The result of the survey: over 95% of the participants would recommend PRTG – or already have.

Paessler PRTG is used by companies of all sizes. Sysadmins love PRTG because it makes their job a whole lot easier.
Bandwidth, servers, virtual environments, websites, VoIP services – PRTG keeps an eye on your entire network.
Everyone has different monitoring needs. That’s why we let you try PRTG for free.