• Company
    • About Us
    • Case Studies
    • Press Center
    • Events
    • Careers
    • Blog
    • Contact us
  • Login
 
  • English
    • Deutsch
    • Español
    • Français
    • Italiano
    • Português
Paessler
                    - The Monitoring Experts
  • Products
    • Paessler PRTG
      Paessler PRTGMonitor your whole IT infrastructure
      • PRTG Network Monitor
      • PRTG Enterprise Monitor
      • PRTG Hosted Monitor
      • PRTG extensionsExtensions for Paessler PRTGExtend your monitoring to a new level
    • Icon Features
      FeaturesExplore all monitoring features
      • Maps & dashboards
      • Alerts & notifications
      • Multiple user interfaces
      • Distributed monitoring
      • Customizable reporting
  • Solutions
    • Industries
      IndustriesMonitor various industry sectors
      • Industrial
      • Healthcare
      • Data Center
      • Education
      • Finance
      • Government
    • IT Topics
      IT TopicsMonitor all areas of IT
      • Network Monitoring
      • Bandwidth Monitoring
      • SNMP Monitor
      • Network Mapping
      • WiFi Monitoring
      • Server Monitoring
  • Pricing
  • Resources
    • Getting Started
      Getting StartedModules for self-paced learning
    • How-to Guides
      How-to GuidesGet the most out of PRTG
    • Videos & Webinars
      Videos & WebinarsLearn from Paessler experts
    • IT  Knowledge
      IT KnowledgeExpand your IT knowledge
    • PRTG Manual
      PRTG ManualFull documentation
    • Knowledge Base
      Knowledge BaseShare community knowledge
    • PRTG Sensor Hub
      PRTG Sensor HubGet sensors, scripts & templates
    • Trainings
      PRTG TrainingLearn how to work with PRTG
  • Partners
    • icon star
      New Partners and MSPBecome a new partner or MSP
    • icon partner
      Partner PortalLog in to your partner account
    • icon search
      Find a PartnerFind partners selling Paessler products
    • icon technology
      Technology AlliancesSee Paessler technology partnerships
  • Company
    • About Us
    • Case Studies
    • Press Center
    • Events
    • Careers
    • Blog
    • Contact us
  • Login
  • English
    • Deutsch
    • Español
    • Français
    • Italiano
    • Português
  • Get a quote
  • Free trial
  1. Home>
  2. IT Topics>
  3. Hardware>
  4. Port Monitoring
PRTG Logo

Port Monitoring with PRTG

Prevent port connection issues and network vulnerabilities

  • Query port status such as open/closed or up/down
  • Keep an eye on connections using UPD and TCP protocols
  • Monitor bandwidth and traffic via SNMP, NetFlow & packet sniffing
Free download
product overview

Our users give top ratings for monitoring with Paessler PRTG

Gartner peer insights
spiceworks
Capterra
G2
Trustpilot

PRTG port monitoring: What you will find on this page

Table of content
  • 6 reasons why to choose PRTG as your port monitoring tool
  • 5 use cases where port monitoring with PRTG helps you out of trouble
  • Hardware ports that you should keep an eye on
  • Explore our preconfigured PRTG sensors for port monitoring
  • Port monitoring: FAQ

PRTG makes port monitoring as easy as it gets

Custom alerts and data visualization let you quickly identify and prevent port connection issues.

Free download
PRODUCT OVERVIEW

6 reasons why to choose PRTG as your port monitoring tool

Keep an eye on possible port security issues

Open ports put your network at risk as they are a point of entry for trojans and other malware. It takes a lot of effort to manually check which ports are open or closed.

Often, ports are opened temporarily for individual applications and then forgotten. In such cases, Paessler PRTG checks if TCP/IP ports are open and alerts you in case of an issue.

Get insights into the traffic on your ports

Our PRTG port monitoring software helps you monitor the traffic that runs through your routers and switches, as well as the amount of bandwidth that is consumed.

Set up our preconfigured sensors for port traffic monitoring using various technologies such as SNMP, flow protocols (NetFlow, IPFIX, jFlow, and sFlow), and packet sniffing.

Check packet delays and packet losses

You can monitor both TCP and UDP packets with PRTG port analyzer.

This way, you can identify packet delays or packet losses immediately, along with their impact on the quality of service.

In addition, it is possible to monitor the connectivity of TCP ports and their response to specific commands.

Monitor multiple ports across devices

PRTG is designed to monitor multiple ports across several devices simultaneously.

You can add sensors for various ports on different devices and view their status on the centralized PRTG dashboard.

This gives you a comprehensive view of the network's health and helps in identifying potential issues that might affect multiple devices or connections.

Receive instant alerts on unusual port activity

In PRTG, you can set up notifications based on various conditions.

You can configure the system to alert you via email, SMS, push notifications, or even execute HTTP actions if a monitored port goes down or experiences unusual activity.

This helps to immediately identify and address potential issues before they escalate.

Generate custom reports on port monitoring data

With the reporting feature in PRTG, you can easily generate detailed reports on port activity over specified time periods.

Customize the report using various settings and filters to focus on the port data that is most relevant for your needs.

Once generated, you can view the reports online or export them in various formats.

What port monitoring looks like in PRTG

Diagnose network issues by continuously tracking different ports in your network. Show port status on your network devices, such as switches and firewalls, response time, uptime, throughput, bandwidth usage, and other key metrics in real time. Visualize monitoring data in clear graphs and dashboards to identify problems more easily. Gain the overview you need to troubleshoot device outages, downtime, and all kinds of port connection issues.

PRTG Screenshot device tree view

Device tree view of the complete monitoring setup

PRTG screenshot map entire it infrastructure

Custom PRTG dashboard for keeping an eye on the entire IT infrastructure

PRTG screenshot graph live data traffic

Live traffic data graph in PRTG

Start monitoring ports with PRTG and see how it can make your network more reliable and your job easier.

Free download
PRODUCT OVERVIEW

IT experts agree: Paessler PRTG is a great solution for IT infrastructure monitoring

PCMag

“All-around winning
 network monitor”

IT Brief

“The real beauty of PRTG is the endless possibilities it offers”

ITPro

“PRTG Network Monitor 
is very hard to beat”

5 use cases where port monitoring with PRTG helps you out of trouble

  • Enhance your network security by blocking or deactivating unused ports.
  • Easily detect overloaded parts of your network by measuring bandwidth and traffic.
  • Visualize the coherences in your network. Sometimes the problem is not a defective port, but the cable.
  • Instantly pinpoint the reasons for shaky connections in your network.
  • Strengthen your security by recognizing unauthorized physical access to your network

Hardware ports that you should keep an eye on

Switch ports

Switches are often bottlenecks and the failure of a single switch can impact an entire network. With switch port monitoring, you can see at a glance how much traffic runs through your switch.

Router ports

How many router ports are currently in use and how many are still free? How high is the bandwidth load? With continuous router port scans, you can identify early on when ports reach their capacity.

Server ports

Servers are at the heart of any IT infrastructure. If a server port fails, this can be felt in the whole network immediately. With PRTG, you can monitor your servers as well as your server ports.

Explore our preconfigured PRTG sensors for port monitoring

PRTG comes with more than 250 native sensor types for monitoring your entire on-premises, cloud, and hybrid cloud environment out of the box. Check out some examples below!

Port v2

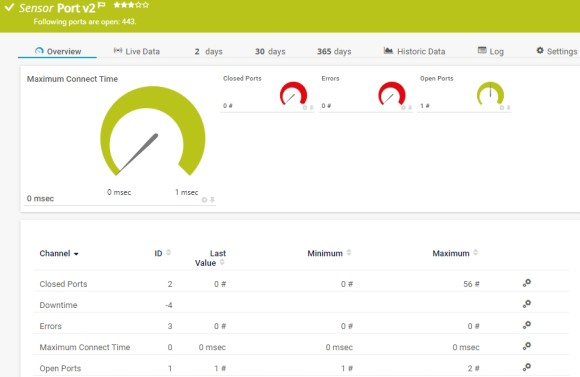
The Port v2 sensor monitors a network service by connecting to one or more of its TCP/IP ports. It can show the following:

  • Number of open and closed ports
  • Number of errors
  • Maximum time until a request to connect to a port was accepted
Port v2
Port v2

Port Range

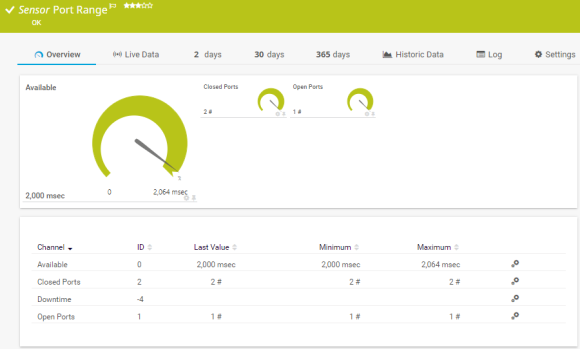
The Port Range sensor monitors a network service by connecting to various TCP/IP ports. It tries to connect to the specified TCP/IP port numbers of a device in succession and waits for the device to accept each request. It can show the following:

  • Time until requests to ports are accepted
  • Number of open and closed ports
Port Range
Port Range

SSL Security Check

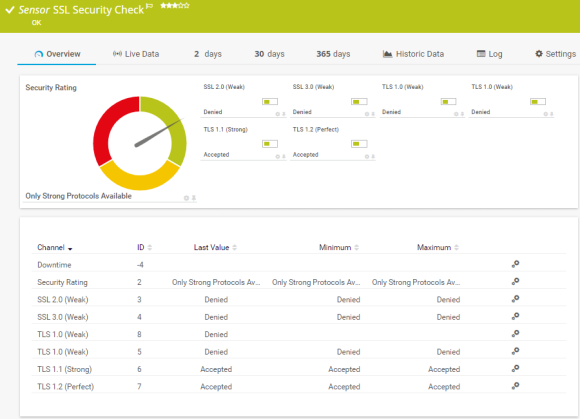
The SSL Security Check sensor monitors Secure Sockets Layer (SSL)/Transport Layer Security (TLS) connectivity to the port of a device. It tries to connect to the specified TCP/IP port number of a device with different SSL/TLS versions and shows if the device supports a particular protocol. It can show the following:

  • Security of the connection to the defined port
  • Status of connections using SSL v3, TLS 1.0, TLS 1.1, TLS 1.2, and TLS 1.3
SSL Security Check
SSL Security Check

See the PRTG Manual for a list of all available sensor types.

PRTG is compatible with all major vendors, products, and systems

compatible with all major vendors, products, and systems

PRTG makes port monitoring as easy as it gets

Custom alerts and data visualization let you quickly identify and prevent port connection issues.

Free download
PRODUCT OVERVIEW

“From a server perspective, we're monitoring all of the key components of our service such as CPU usage, RAM disk space, the Windows services that it's running, and network connectivity of that server. In terms of networks, we’re monitoring all of our switches, firewalls, and access points. It’s really useful to be able to easily pull performance metrics from the PRTG dashboard.”

Ollie Kerslake, Infrastructure Lead
Riverford Organic Farmers

“The tool has given us greater control over all types of devices connected to the network (switches, IP telephony, security cameras, IoT, WiFi) that previously remained opaque when dealing with service incidents. This has improved our ability to diagnose and resolve problems, which has translated into greater efficiency and a better user experience in both internal and public services.”

Jordi Tolosà Bel, New Technologies Technician
Vinaroz City Council

“Our objective was to be able to monitor the health of our most critical servers containing data and applications, but also the flows and bandwidth between headquarters, our 50 servers in the cloud and the 15 servers at our production sites. For us, it is essential to have a proactive approach to understand where the weaknesses of the IT system are to be able to improve them.”

Marc Boullier, CIO
Carambar & Co

Your port monitor at a glance – even on the go

PRTG is set up in a matter of minutes and can be used on a wide variety of mobile devices.

device overview

Create innovative solutions with Paessler’s IT partners

Partnering with innovative IT vendors, Paessler unleashes synergies to create
new and additional benefits for joined customers.

IP Fabric

IP Fabric

Combining PRTG’s broad monitoring feature set with IP Fabric’s automated network assurance creates a new level of network visibility and reliability.

Read more
Rhebo

Rhebo

Rhebo and PRTG offer a comprehensive monitoring solution for IT and OT environments: from condition monitoring through to anomaly and threat detection.

Read more

Find the root cause of the problem with our PRTG port monitoring solution

Real-time notifications mean faster troubleshooting so that you can act before more serious issues occur.

Free download
PRODUCT OVERVIEW
Paessler PRTG

Paessler PRTG

Network Monitoring Software – Version 24.4.102.1351 (November 12th, 2024)

Hosting icon

Hosting

Download for Windows and cloud-based version PRTG Hosted Monitor available

Languages icon

Languages

English, German, Spanish, French, Portuguese, Dutch, Russian, Japanese, and Simplified Chinese

test

Monitor everything

Network devices, bandwidth, servers, applications, virtual environments, remote systems, IoT, and more

test

Pricing

Choose the PRTG Network Monitor subscription that's best for you

Discover more monitoring insights and stories

Resources Solution

Solutions for all your monitoring needs

  • SNMP port analyzer PRTG
  • Cisco switch monitoring
  • TCP monitoring
Resources Content

Powerful stories from the monitoring world

  • IT monitoring secures the gateway to Central Africa
  • Traffic monitoring on HP Aruba switches with sFlow and PRTG
  • Instructions On How To Set Up Port Forwarding - On Almost Any Router
Resources Solutions

Resources to master your monitoring challenges

  • Port Monitoring - Dell Switch
  • Port Monitoring
  • Port Sensor

Port Monitoring: FAQ


What is a port?

A port is a part of the network address and ensures the proper distribution of connections and data packets. Valid port numbers range from 0 to 65535. Many applications use typical or standardized ports like FTP (port 20), SMTP (port 25), and SNMP (port 161). These ports are used primarily by protocols such as the Transmission Control Protocol (TCP) and User Datagram Protocol (UDP).

What are common port protocols?

The Transmission Control Protocol (TCP) is the most commonly used protocol to send packets. It operates in a connection-oriented manner and requires the establishment of a connection between a client and server before any data can be sent. The server needs to be in a listening state (referred to as passive open) to accept connection requests from clients. the resulting load is higher than with UDP. There are standardized ports for TCP.

The User Datagram Protocol (UDP) is a connectionless protocol. There is no sequential numbering and it generates much less load. Therefore, UDP is more economical, but also more prone to errors. The UDP protocol is often used for applications where packet loss is not that important. There are also standardized ports for UDP.

How does Paessler PRTG help me with port monitoring?

Paessler PRTG is a comprehensive network and port monitoring tool that helps administrators keep an eye on the health and performance of their networks. In the context of port monitoring, PRTG can monitor the status and activity of network ports on various devices, helping to identify potential issues such as traffic bottlenecks, unauthorized access, or malfunctioning ports. It can monitor ports on switches, routers, and other network devices to ensure optimal network performance.

What is the difference between port monitoring and a port sniffer?

Port monitoring is a network management technique that is used to analyze traffic on specific ports and to determine whether ports are open or closed for maintaining network security and performance.

A port sniffer is a tool or software that captures and analyzes data on network ports. It is commonly used for network diagnostics and troubleshooting. While port monitoring offers a broader range of functionalities including security features, a port sniffer focuses more on detailed data packet analysis and can be used for specific investigations or audits.

How does port mirroring work with PRTG?

Port mirroring is a network technique that allows you to copy or mirror the network traffic from one network port (or multiple ports) and send that copy to another port on the same network switch. In PRTG, port mirroring is used by the Packet Sniffer sensor to monitor header traffic.

Which ports does PRTG use?

PRTG requires several ports to be open and reachable on your system for full functionality. Here you can find a first overview:

  • LDAP port for Active Directory integration: 389 (unsecure), 636 (secure)
  • Auto-update and activation: 443
  • Communication between cluster nodes: 23570
  • Incoming remote probe connections: 23560
  • Notifications: 443 (push), 25 (SMTP), 162 (SNMP trap), 514 (Syslog)
  • PRTG application server and PRTG core server: 23580
  • PRTG web server: 443 (secure), 80 (unsecure); fallbacks: 8443 and 8443+ (secure), 8080+ (unsecure)
  • Report generation (PDF): 8085
  • Update check and download: 80
What is a sensor in PRTG?

In PRTG, “sensors” are the basic monitoring elements. One sensor usually monitors one measured value in your network, for example the traffic of a switch port, the CPU load of a server, or the free space on a disk drive. On average, you need about 5-10 sensors per device or one sensor per switch port.

We asked: would you recommend PRTG? Over 95% of our customers say yes!

Paessler conducted trials in over 600 IT departments worldwide to tune its network monitoring software closer to the needs of sysadmins. The result of the survey: over 95% of the participants would recommend PRTG – or already have.

recommendation

Still not convinced?

Love

More than 500,000 sysadmins love PRTG

Paessler PRTG is used by companies of all sizes. Sysadmins love PRTG because it makes their job a whole lot easier.

PRTG

Monitor your entire IT infrastructure

Bandwidth, servers, virtual environments, websites, VoIP services – PRTG keeps an eye on your entire network.

test

Try Paessler PRTG for free

Everyone has different monitoring needs. That’s why we let you try PRTG for free.

PRTG Logo

Start monitoring ports with PRTG and see how it can make your network more reliable and your job easier.

Free download
PRODUCT OVERVIEW

Products

  • Paessler PRTG
    Paessler PRTGMonitor your whole IT infrastructure
    • PRTG Network Monitor
    • PRTG Enterprise Monitor
    • PRTG Hosted Monitor
  • PRTG extensions
    Extensions for Paessler PRTGExtend your monitoring to a new level
  • Icon Features
    FeaturesExplore all monitoring features

Monitoring with PRTG

  • Network monitoring
  • Bandwidth monitoring
  • SNMP monitoring
  • Network mapping
  • Wi-Fi monitoring
  • Server monitoring
  • Network traffic analyzer
  • NetFlow monitoring
  • Syslog server

Useful Links

  • PRTG Manual
  • Knowledge Base
  • Customer Success Stories
  • About Paessler
  • Subscribe to newsletter
  • PRTG Support
  • PRTG Consulting

Contact

Paessler GmbH
Thurn-und-Taxis-Str. 14, 
90411 Nuremberg 
Germany

[email protected]

+49 911 93775-0

  • Contact us
©2025 Paessler GmbHTerms & ConditionsPrivacy PolicyImprintReport VulnerabilityDownload & InstallSitemap
Manual License Activation Manual License Activation Manual License Activation