• Company
    • About Us
    • Case Studies
    • Press Center
    • Events
    • Careers
    • Blog
    • Contact us
  • Login
 
  • English
    • Deutsch
    • Español
    • Français
    • Italiano
    • Português
Paessler
                    - The Monitoring Experts
  • Products
    • Paessler PRTG
      Paessler PRTGMonitor your whole IT infrastructure
      • PRTG Network Monitor
      • PRTG Enterprise Monitor
      • PRTG Hosted Monitor
      • PRTG extensionsExtensions for Paessler PRTGExtend your monitoring to a new level
    • Icon Features
      FeaturesExplore all monitoring features
      • Maps & dashboards
      • Alerts & notifications
      • Multiple user interfaces
      • Distributed monitoring
      • Customizable reporting
  • Solutions
    • Industries
      IndustriesMonitor various industry sectors
      • Industrial
      • Healthcare
      • Data Center
      • Education
      • Finance
      • Government
    • IT Topics
      IT TopicsMonitor all areas of IT
      • Network Monitoring
      • Bandwidth Monitoring
      • SNMP Monitor
      • Network Mapping
      • WiFi Monitoring
      • Server Monitoring
  • Pricing
  • Resources
    • Getting Started
      Getting StartedModules for self-paced learning
    • How-to Guides
      How-to GuidesGet the most out of PRTG
    • Videos & Webinars
      Videos & WebinarsLearn from Paessler experts
    • IT  Knowledge
      IT KnowledgeExpand your IT knowledge
    • PRTG Manual
      PRTG ManualFull documentation
    • Knowledge Base
      Knowledge BaseShare community knowledge
    • PRTG Sensor Hub
      PRTG Sensor HubGet sensors, scripts & templates
    • Trainings
      PRTG TrainingLearn how to work with PRTG
  • Partners
    • icon star
      New Partners and MSPBecome a new partner or MSP
    • icon partner
      Partner PortalLog in to your partner account
    • icon search
      Find a PartnerFind partners selling Paessler products
    • icon technology
      Technology AlliancesSee Paessler technology partnerships
  • Company
    • About Us
    • Case Studies
    • Press Center
    • Events
    • Careers
    • Blog
    • Contact us
  • Login
  • English
    • Deutsch
    • Español
    • Français
    • Italiano
    • Português
  • Get a quote
  • Free trial
  1. Home>
  2. IT Topics>
  3. Technology>
  4. Packet Sniffer
PRTG Logo

Packet Sniffer with PRTG

Keep a 24/7 eye on packet capture in your network and optimize performance and security

  • Monitor traffic and data packets that flow through your network
  • Filter by IP address, protocol, data type, and more for in-depth traffic analysis
  • Get out-of-the-box support of NetFlow, jFlow, sFlow, IPFIX, SNMP, and WMI
Free download
product overview

Our users give top ratings for monitoring with Paessler PRTG

Gartner peer insights
spiceworks
Capterra
G2
Trustpilot

PRTG packet sniffer: What you will find on this page

Table of content
  • 3 reasons why to choose PRTG as your packet sniffing tool
  • What packet sniffing looks like in PRTG
  • 3 use cases for packet sniffing with PRTG
  • Explore our preconfigured PRTG sensors for Packet Sniffe
  • Packet Sniffer: FAQ

PRTG makes packet sniffing as easy as it gets

Custom alerts and data visualization let you quickly identify and prevent network congestion and unusual data traffic.

Free download
PRODUCT OVERVIEW

3 reasons why to choose PRTG as your packet sniffing tool

PRTG's all-in-one network monitoring, including packet sniffing, gives you valuable insights about your IT infrastructure and network performance. PRTG is a packet sniffer tool for Windows that offers a number of possibilities for bandwidth monitoring and network traffic analysis.

icon Settings

Choose between various technologies

PRTG comes with various preconfigured sensors for monitoring and analyzing data packets, using different technologies like packet sniffing, SNMP, WMI, and flow (NetFlow, jFlow, sFlow, IPFIX). You can therefore decide on a case-by-case basis which protocol works best for you.

For example, you may decide to use NetFlow for your Cisco hardware or SNMP for an overview of your overall traffic. PRTG is the perfect network sniffer for all your hardware.

icon Firewall

Stop bandwidth hogs in their tracks

PRTG shows clearly which applications use most bandwidth and how much traffic flows through your network. Its easy-to-read dashboards offer a quick graphical overview as well as detailed statistics about different parameters such as CPU usage or network bandwidth utilization.

Thus you are able to stop bandwidth bottlenecks and put your resources to better use.

icon statistics

24/7 comprehensive traffic overview

PRTG’s toplists provide charts of protocols, connections, and the IP addresses of devices that are the top talkers in your network. You also get a detailed overview of mail traffic, file transfer traffic, remote control traffic, and more.

Not what you need? No problem. You can easily customize your packet sniffing to suit and create your own toplists based on the information you require.

What packet sniffing looks like in PRTG

Diagnose network issues by continuously tracking captured packets on single devices or in your entire network. Show Show packet loss, suspicious network activity, bandwidth usage by IP, protocol, or application, and other key metrics in real time. Visualize monitoring data in clear graphs and dashboards to identify problems more easily. Gain the overview you need to troubleshoot network congestion and prevent bandwidth bottlenecks.

PRTG Screenshot device tree view

Device tree view of the complete monitoring setup

PRTG screenshot map entire it infrastructure

Custom PRTG dashboard for keeping an eye on the entire IT infrastructure

PRTG screenshot graph live data traffic

Live traffic data graph in PRTG

Start packet sniffing with PRTG and see how it can make your network more reliable and your job easier.

Free download
PRODUCT OVERVIEW

IT experts agree: Paessler PRTG is a great solution for IT infrastructure monitoring

PCMag

“All-around winning
 network monitor”

IT Brief

“The real beauty of PRTG is the endless possibilities it offers”

ITPro

“PRTG Network Monitor 
is very hard to beat”

3 use cases for packet sniffing with PRTG

Icon 1

Identify consumption trends

A server administrator at a medium-sized company with around 5,000 employees finds that for two days, bandwidth use has increased sharply.

Using the PRTG’s packet sniffer, he determines that a new cloud app is using too much bandwidth, resulting in additional demands on the network infrastructure.

Icon 2

Reduce bandwidth costs

An admin at a company with around 15,000 employees wants to find out if it is possible to cut back on the amount of bandwidth that is ordered from their bandwidth service provider.

Using packet sniffing, they find out that the company's total bandwidth consumption is significantly lower than the amount which has been purchased. By using the packet analyzer, costs can be reduced in the long term.

Icon 3

Increase network security

A network administrator at a medium-sized medical technology company filters traffic according to IP addresses and network protocols. They use a packet analyzer and find that P2P data is circulating via a certain IP address outside business hours.

They may therefore be dealing with a network security problem, which, thanks to PRTG monitoring, can quickly be fixed.

Explore our preconfigured PRTG sensors for packet sniffing

PRTG comes with more than 250 native sensor types for monitoring your entire on-premises, cloud, and hybrid cloud environment out of the box. Check out some examples below!

Packet Sniffer

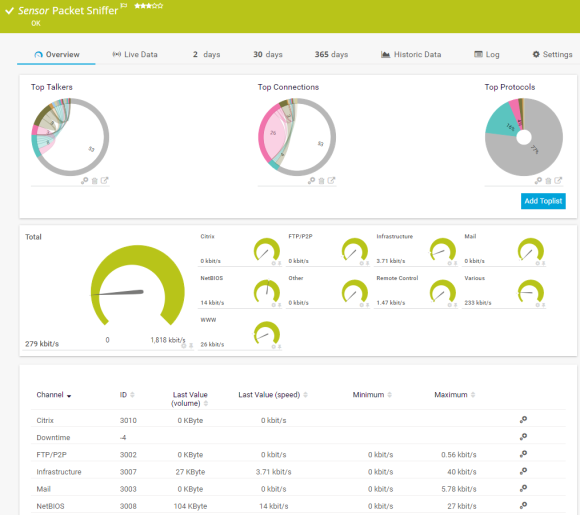
The Packet Sniffer sensor monitors the headers of data packets that pass a local network card using a built-in packet sniffer. You can choose from predefined channels. It can show the following and more:

  • Traffic from Citrix applications
  • Traffic from file transfer (FTP/P2P) and various other protocols (UDP, TCP)
  • Traffic from network services (DHCP, DNS, Ident, ICMP, SNMP)
  • Internet mail traffic (IMAP, POP3, SMTP)
  • Traffic from remote control applications (RDP, SSH, Telnet, Virtual Network Computing (VNC))
Packet Sniffer
Packet Sniffer

SNMP Traffic v2

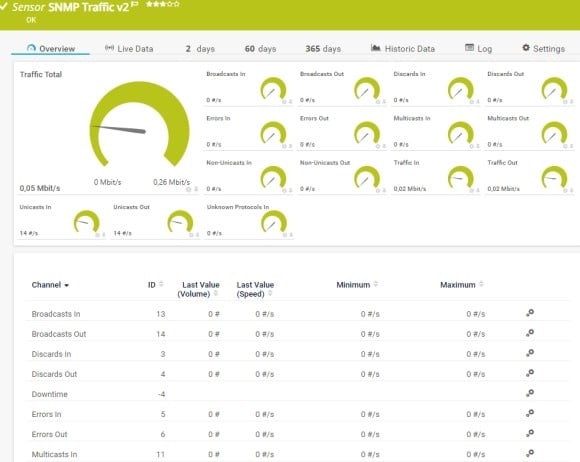
The SNMP Traffic v2 sensor monitors bandwidth and traffic on a device. It can show the following:

  • Number of incoming and outgoing broadcast, multicast, unicast, and non-unicast packets
  • Number of incoming and outgoing discards and errors
  • Total, incoming, and outgoing traffic
  • Number of incoming, unknown protocols
SNMP Traffic v2
SNMP Traffic v2

Windows Network Card

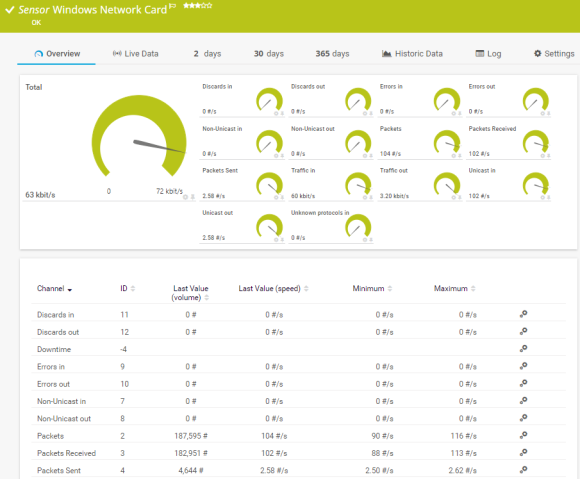
The Windows Network Card sensor monitors the bandwidth usage and traffic of a network interface via Windows Management Instrumentation (WMI) or Windows performance counters. It can show the following:

  • Number of incoming and outgoing discards, errors, and unicast and non-unicast packets
  • Total, incoming, and outgoing traffic
  • Number of packets total, sent, and received
  • Number of unknown protocols
Windows Network Card

IPFIX

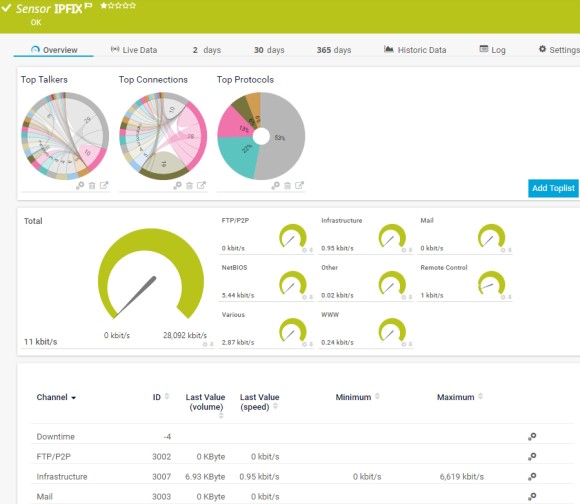
The IPFIX sensor receives traffic data from an Internet Protocol Flow Information Export (IPFIX) compatible device and shows traffic by type. It can show the following and more:

  • Traffic from Citrix applications
  • Traffic from file transfer (FTP/P2P) and various other protocols (UDP, TCP)
  • Traffic from network services (DHCP, DNS, Ident, ICMP, SNMP)
  • Internet mail traffic (IMAP, POP3, SMTP)
  • Traffic from remote control applications (RDP, SSH, Telnet, Virtual Network Computing (VNC))
PFIX
PFIX

See the PRTG Manual for a list of all available sensor types.

PRTG is compatible with all major vendors, products, and systems

compatible with all major vendors, products, and systems

PRTG makes packet sniffing as easy as it gets

Custom alerts and data visualization let you quickly identify and prevent network congestion and unusual data traffic.

Free download
PRODUCT OVERVIEW

“We strive to equip our systems with state-of-the-art technology to safeguard our educational practices for the future. Part of this includes ensuring that all our systems run smoothly at all times. On any given day, we rarely have time to keep an eye on all our systems. We therefore decided to monitor our school’s IT environment with a centralized network monitoring tool.”

Stefan Roschewitz, IT administrator
BBS Holzminden

“We want to include the tool in our set of solutions in order to solve problems more proactively in our technology infrastructure. PRTG has exceeded all our expectations because it is a reliable, extremely easy-to-use solution. There is no doubt that it lives up to the renowned quality of German technology.”

Esbin Saúl Lázaro García, IT Infrastructure and Security Engineer
Hospital El Pilar

“The reactivity, know-how, and technical solutions of Paessler are outstanding in every situation. For me, no monitoring tool compares to PRTG.”

Andreas Reimann, Senior Networking Communication Architect
Zurich Airport

Your packet analyzer at a glance – even on the go

PRTG is set up in a matter of minutes and can be used on a wide variety of mobile devices.

device overview
Gartner peer insights

“Great interface, intuitive, full REST support. custom scripts, rest sensors add extra value. We have been using PRTG for 10 years now in multiple environments and use cases. it has by far the best interface and very easy to setup without prior experience.”

Read the complete review at Gartner Peer Insights

Create innovative solutions with Paessler’s IT partners

Partnering with innovative IT vendors, Paessler unleashes synergies to create
new and additional benefits for joined customers.

Martello

Martello 

By integrating PRTG with Martello iQ, you can add a fast analytics layer to improve uptime, visualize your IT environment, and integrate all of your IT systems into a single pane of glass.

Read more
NetBrain

NetBrain

Integrating monitoring results from PRTG into NetBrain maps makes the foundation for network automation.

Read more
Siemon

Siemon

Siemon and Paessler bring together intelligent building technology and advanced monitoring and make your vision of intelligent buildings and data centers become reality.

Read more

Find the root cause of the problem with our PRTG network packet sniffer solution

Real-time notifications mean faster troubleshooting so that you can act before more serious issues occur.

Free download
PRODUCT OVERVIEW
Paessler PRTG

Paessler PRTG

Network Monitoring Software – Version 24.4.102.1351 (November 12th, 2024)

Hosting icon

Hosting

Download for Windows and cloud-based version PRTG Hosted Monitor available

Languages icon

Languages

English, German, Spanish, French, Portuguese, Dutch, Russian, Japanese, and Simplified Chinese

test

Monitor everything

Network devices, bandwidth, servers, applications, virtual environments, remote systems, IoT, and more

test

Pricing

Choose the PRTG Network Monitor subscription that's best for you

Discover more monitoring insights and stories

Resources Solution

Solutions for all your monitoring needs

  • Bandwidth Management Using the PRTG Network Packet Sniffer
  • Free Network Sniffer
  • Packet Analyzer
Resources Content

Powerful stories from the monitoring world

  • What is Packet Sniffing? Definition and Details
  • Video: Bandwidth monitoring with flows and packet sniffing
  • Sensor of the Week: Packet Sniffer Sensor
Resources Solutions

Resources to master your monitoring challenges

  • Packet Sniffer Sensor
  • Monitoring Bandwidth via Packet Sniffing
  • Packet Sniffer Sensor doesn't recognize network adapter

Packet Sniffer: FAQ


What is packet sniffing?

Packet sniffing is the process of capturing each packet that is transmitted over the network and analyzing its content. Most of the time, packet sniffing is used to troubleshoot network problems or to gather network statistics. The software or device used for capturing packet data is called packet sniffer, packet analyzer, network sniffer, or simply network analyzer.

What are the benefits of using a packet sniffer?

A packet sniffer, also known as a network analyzer or protocol analyzer, is a tool used to capture, analyze, and monitor network traffic. It offers several benefits, particularly in network management, security, and troubleshooting. Here are the key benefits:

  • Network troubleshooting: Packet sniffers help pinpoint network issues like bottlenecks, latency, and dropped packets. They can inspect protocol-level details to diagnose misconfigurations or malfunctions. By monitoring traffic flow, sniffers can identify why a connection is failing, such as due to a firewall rule or incorrect routing.
  • Performance monitoring: Packet sniffers can monitor which devices or applications are consuming excessive bandwidth. Understanding traffic patterns can help optimize network performance and capacity planning.
  • Cybersecurity and threat detection: Packet sniffers can detect unauthorized access by hackers, unusual traffic, or potential threats like malware communication. They help analyze malicious activity by capturing evidence of hacking attempts or unauthorized data exfiltration.
How do I configure PRTG for packet sniffing?

Option #1: Monitor data traffic on one device

If you wish to monitor just one single device or endpoint – such as your web server – then do the following: Install a remote probe on the device. Create a Packet Sniffer sensor and select the kind of traffic you want to monitor. You can usually choose between the most important network protocols.

Option #2: Monitor all your data traffic

If you wish to monitor your entire IT infrastructure, you must ensure that all your data traffic is captured. Set up a monitoring port on a central router or switch. Use a network cable to connect the router or switch to the network card of a computer that is running a PRTG probe. Copies of all data packets are now traveling via your probe system and you can create a Packet Sniffer sensor on the corresponding probe device. Filter according to the information you wish you monitor.

Why should I do mail traffic, file transfer, and LAN sniffing with PRTG?

Mail traffic sniffing with PRTG

IT managers and system administrators need to be informed immediately if mail traffic suddenly goes through the roof. Spikes in traffic can be caused by a single email. On the other hand, maybe your mail server has been attacked. Traffic sniffing is therefore vital to the security of your network.

File transfer sniffing with PRTG

You’ll also want to keep an eye on your FTP servers. Here, traffic sniffing means making sure uploads and downloads function properly. But that’s not all: it also lets you detect disruptions or unusual spikes in data.

LAN sniffing with PRTG

Many administrators are in search of LAN sniffer or Wi-Fi sniffers. Why? Because spikes in ethernet or wireless network traffic can lead to malfunctions and disruptions, causing performance to plummet. LAN sniffing is also useful for getting an overall idea of the resources and data types that are generating the most traffic.

What is a sensor in PRTG?

In PRTG, “sensors” are the basic monitoring elements. One sensor usually monitors one measured value in your network, for example the traffic of a switch port, the CPU load of a server, or the free space on a disk drive. On average, you need about 5-10 sensors per device or one sensor per switch port.

We asked: would you recommend PRTG? Over 95% of our customers say yes!

Paessler conducted trials in over 600 IT departments worldwide to tune its network monitoring software closer to the needs of sysadmins. The result of the survey: over 95% of the participants would recommend PRTG – or already have.

recommendation

Still not convinced?

Love

More than 500,000 sysadmins love PRTG

Paessler PRTG is used by companies of all sizes. Sysadmins love PRTG because it makes their job a whole lot easier.

PRTG

Monitor your entire IT infrastructure

Bandwidth, servers, virtual environments, websites, VoIP services – PRTG keeps an eye on your entire network.

test

Try Paessler PRTG for free

Everyone has different monitoring needs. That’s why we let you try PRTG for free.

PRTG Logo

Start packet sniffing with PRTG and see how it can make your network more reliable and your job easier.

Free download
PRODUCT OVERVIEW

Products

  • Paessler PRTG
    Paessler PRTGMonitor your whole IT infrastructure
    • PRTG Network Monitor
    • PRTG Enterprise Monitor
    • PRTG Hosted Monitor
  • PRTG extensions
    Extensions for Paessler PRTGExtend your monitoring to a new level
  • Icon Features
    FeaturesExplore all monitoring features

Monitoring with PRTG

  • Network monitoring
  • Bandwidth monitoring
  • SNMP monitoring
  • Network mapping
  • Wi-Fi monitoring
  • Server monitoring
  • Network traffic analyzer
  • NetFlow monitoring
  • Syslog server

Useful Links

  • PRTG Manual
  • Knowledge Base
  • Customer Success Stories
  • About Paessler
  • Subscribe to newsletter
  • PRTG Support
  • PRTG Consulting

Contact

Paessler GmbH
Thurn-und-Taxis-Str. 14, 
90411 Nuremberg 
Germany

[email protected]

+49 911 93775-0

  • Contact us
©2025 Paessler GmbHTerms & ConditionsPrivacy PolicyImprintReport VulnerabilityDownload & InstallSitemap
Free Syslog Server Free Syslog Server Free Syslog Server