Custom alerts and data visualization let you quickly identify and prevent IP traffic issues.
Paessler PRTG makes it easy for you to take stock of your IT infrastructure. It automatically discovers all network devices within a specified IP address range in your subnet and adds them to your monitoring setup. This way, you can not only save lots of time, but also find out if there are devices connected to your network that should not be there at all.
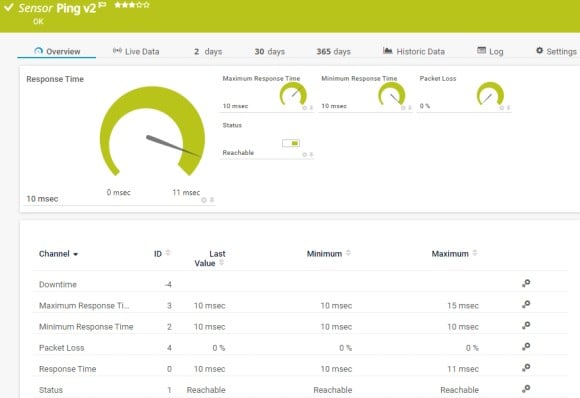
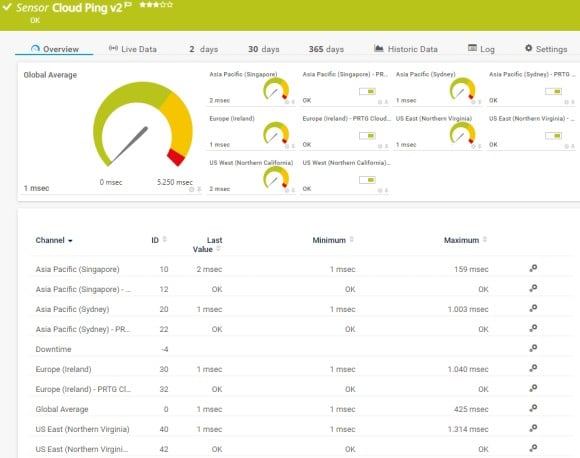
If you want to see if your devices are reachable over the network or the internet, just use the Ping v2 or the Cloud Ping v2 sensors in PRTG. These sensors ping the IP address of a device and immediately notify you if the device is not available as expected. This way, you can react as quickly as possible and fix the issue before it becomes business critical.
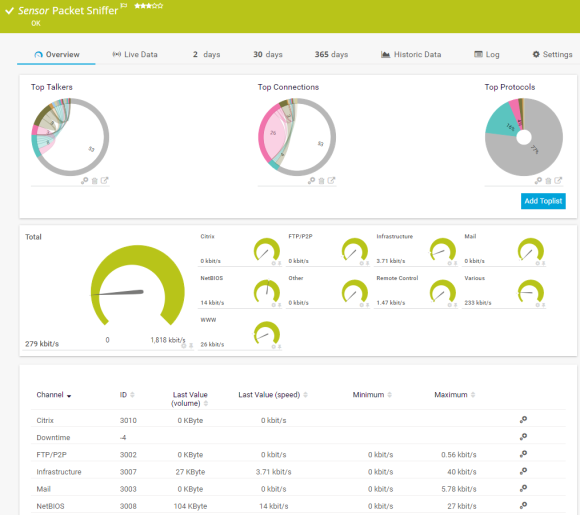
With our Packet Sniffer and Flow (NetFlow, jFlow, sFlow, IPFIX) sensors, you can easily identify bottlenecks in your network while keeping an eye on network security at the same time. These sensors break down and visualize network traffic by IP address, port, or protocol so that you can pinpoint the IP addresses that consume the most bandwidth in your LAN at a quick glance.
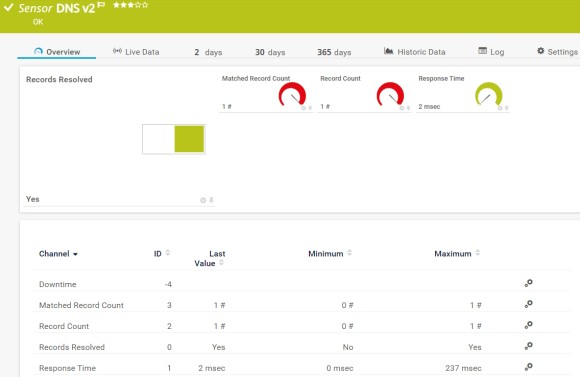
Measure the response time of your DNS server and make sure that it is protected against attacks over the internet using the DNS v2 sensor. This sensor resolves domain name records and compares them to a filter. This way, you can make sure that no one has compromised the DNS cache to redirect employees or customers to malicious websites, for example.
Diagnose network issues by continuously tracking the IP addresses of your network devices, including routers, switches, Linux and Windows servers, and other endpoints. Show uptime, response time, traffic by IP address, and other key metrics in real time. Visualize monitoring data in clear graphs and dashboards to identify problems more easily. Gain the overview you need for troubleshooting network configuration issues.

Device tree view of the complete monitoring setup

Custom PRTG dashboard for keeping an eye on the entire IT infrastructure

Live traffic data graph in PRTG
“All-around winning
network monitor”
“The real beauty of PRTG is the endless possibilities it offers”
“PRTG Network Monitor
is very hard to beat”
As an administrator, you want to keep a close eye on your network traffic. And for good reason: one single IP address can use up so much bandwidth that this might ultimately have negative consequences for your entire IT infrastructure. Thanks to our IP monitoring tool PRTG, you will prevent traffic problems over the long term and thus optimize the performance of your network.
How much traffic passes through your network in total? The SNMP Traffic sensor shows you, for example, the total amount of traffic as well as the incoming and outgoing traffic on your network devices.
Does the Christmas season put added pressure on your online store? With the PRTG IP monitoring solution, you can identify weekly, monthly, and seasonal fluctuations in your network traffic. You'll see how traffic develops over longer periods of time and take measures to adapt bandwidth capacities accordingly.
You can also have a look at your network traffic in greater detail. Via Packet Sniffing, with NetFlow sensors for Cisco devices, or with other flow technologies like sFlow or jFlow, you can analyze your traffic more precisely and fine-tune your IP monitoring.
The sensors display the amount of mail and web traffic, the traffic generated by file transfers or chat protocols, and much more. Where does such data come from? Who is the recipient? Which protocols are used? You can find an answer to all these questions using our IP traffic monitor.
Always know what’s going on in your network – either by looking at the central dashboard that shows your infrastructure as a hierarchical device tree, or by creating custom maps and dashboards with our easy-to-use drag-and-drop editor.
Our network monitoring software uses a simple traffic lights system to warn you (yellow), alert you (red), or show you that everything is working just fine (green). This way, you can see at a quick glance if there is an issue that needs your attention.
With PRTG, you can easily set custom warning and error thresholds that suit your individual monitoring requirements. Define, for example, notification triggers to make sure that the right team is informed as soon as a threshold is exceeded.
In addition, choose from various communication channels such as email, SMS, Teams message, push notification, and more. This way, you can rest assured that if PRTG doesn’t alert you, there’s no issue to solve.
PRTG comes with over 250 preconfigured sensors for monitoring your network devices from the most popular manufacturers as well as your entire IT infrastructure out-of-the-box.
Choose the sensors that you need for your specific requirements – no matter if you want to keep an eye on your on-premises or cloud environment, your server hardware or virtual servers, your websites, and much more.
PRTG comes with more than 250 native sensor types for monitoring your entire on-premises, cloud, and hybrid cloud environment out of the box. Check out some examples below!
The Ping v2 sensor sends an Internet Control Message Protocol (ICMP) echo request ("ping") from the probe system to the parent device to monitor its availability. It can show the following:
• Response time
• Packet loss
• Target status
• Minimum and maximum ping time
The Cloud Ping v2 sensor monitors the Transmission Control Protocol (TCP) ping times to its parent device from different locations worldwide (Asia Pacific: Singapore, Asia Pacific: Sydney, Europe: Ireland, US East: Northern Virginia, US West: Northern California) via the PRTG Cloud. It can show the following:
The Packet Sniffer sensor monitors the headers of data packets that pass a local network card using a built-in packet sniffer. You can choose from predefined channels. It can show the following and more:
The DNS v2 sensor monitors a Domain Name System (DNS) server, resolves domain name records, and compares them to a filter. It can show the following:
See the PRTG Manual for a list of all available sensor types.

Make sure that you comply with your service level agreements by preventing malfunctions and downtimes. Implement IP SLA monitoring, for example, and check the quality of your VoIP connections round the clock.
Monitor your VPN connections and measure network traffic, load, and the number of logged-in users. Identify connection problems and suspicious traffic before they cause real trouble for your customers or colleagues.
Always keep an eye on your firewalls, ports, servers, and other important aspects of your IT infrastructure to maintain the security of your network. Custom alerts notify you in real time about irregularities in your environment.
Custom alerts and data visualization let you quickly identify and prevent IP traffic issues.
PRTG is set up in a matter of minutes and can be used on a wide variety of mobile devices.

Partnering with innovative IT vendors, Paessler unleashes synergies to create
new and additional benefits for joined customers.

Combining PRTG’s broad monitoring feature set with IP Fabric’s automated network assurance creates a new level of network visibility and reliability.

Paessler and Plixer provide a complete solution adding flow and metadata analysis to a powerful network monitoring tool.

With ScriptRunner Paessler integrates a powerful event automation platform into PRTG Network Monitor.
Real-time notifications mean faster troubleshooting so that you can act before more serious issues occur.
Network Monitoring Software – Version 24.4.102.1351 (November 12th, 2024)
Download for Windows and cloud-based version PRTG Hosted Monitor available
English, German, Spanish, French, Portuguese, Dutch, Russian, Japanese, and Simplified Chinese
Network devices, bandwidth, servers, applications, virtual environments, remote systems, IoT, and more
Choose the PRTG Network Monitor subscription that's best for you


IP stands for Internet Protocol and describes a set of standards and requirements for creating and transmitting data packets, or datagrams, across networks. In the OSI model, the Internet Protocol (IP) is considered part of the network layer. IP is traditionally used together with a higher-level protocol, most notably TCP (Transmission Control Protocol). The IP standard is governed by RFC 791.
IP is designed to work over a dynamic network. This means that it must work without a central directory and that it cannot rely upon specific links or nodes that already exist. IP is a connectionless protocol that is datagram oriented, so each packet must contain the source IP address, destination IP address, and other data in the header to be successfully delivered.
An IP address (Internet Protocol address) is a numerical representation that uniquely identifies a specific interface on the network. IP addresses are binary numbers but are typically expressed in decimal form (IPv4) or hexadecimal form (IPv6) to make reading and using them easier for humans.
With both IPv4 and IPv6, remembering the IP address of every device is not really possible. Name resolution provides a way to associate an IP address with a more descriptive name. On the internet, name resolution is handled by the Domain Name System (DNS). With DNS, a name in the format host.domain can be used in place of the destination’s IP address.
There are two versions of IP in use today, IPv4 and IPv6. IPv4 addresses are 32-bit binary numbers that allow for a maximum of 4,294,967,296 (2³²) unique IP addresses. They are written as follows: 168.212.226.204
IPv6 was developed by the Internet Engineering Task Force (IETF) to create a greater IP address space for all devices connected to the internet. In addition, there were changes to improve the efficiency of IP packet headers as well as improvements to routing and security.
IPv6 uses 128-bit addresses, which allows for 3.4 x 1038 (2128) unique IP addresses. They are written in hexadecimal format: 2DAB:FFFF:0000:3EAE:01AA:00FF:DD72:2C4A
IP monitoring tools, also known as IP trackers or IP address monitoring tools, are software applications or online services that is used to monitor and track IP addresses. An IP address is a unique numerical identifier assigned to each device connected to a computer network.
IP monitoring tools are commonly used by network administrators, security professionals, website owners, and individuals concerned about their online privacy and security. By monitoring and tracking IP addresses, these tools enable proactive management, security enhancement, and troubleshooting of network-related issues.
IP monitoring tools provide various functionalities and capabilities to monitor and track IP addresses. Some common features of IP monitoring tools include:
In PRTG, “sensors” are the basic monitoring elements. One sensor usually monitors one measured value in your network, for example the traffic of a switch port, the CPU load of a server, or the free space on a disk drive. On average, you need about 5-10 sensors per device or one sensor per switch port.
Paessler conducted trials in over 600 IT departments worldwide to tune its network monitoring software closer to the needs of sysadmins. The result of the survey: over 95% of the participants would recommend PRTG – or already have.

Paessler PRTG is used by companies of all sizes. Sysadmins love PRTG because it makes their job a whole lot easier.
Bandwidth, servers, virtual environments, websites, VoIP services – PRTG keeps an eye on your entire network.
Everyone has different monitoring needs. That’s why we let you try PRTG for free.