Custom alerts and data visualization let you quickly identify and prevent database server performance issues.
Business operations are almost always based on information that is stored and managed in SQL databases. If you’re a database administrator, you certainly know that for a business to be successful, these database instances must always be up and running to avoid costly downtime.
Database downtime, or crashes, are caused by hardware errors, faulty configurations, or insufficient disk space or memory. Corrupted databases with defective files can also lead to problems.
If a downtime occurs, time is of the essence to prevent data loss and costly interruptions of business services and processes.
Paessler PRTG helps ensure your databases are always available and operating at optimal performance. With its customizable alarm system, you’re informed promptly of any issues before bigger problems arise.
This way, you can quickly resolve the database issue and keep your operations running smoothly.

Diagnose network issues by continuously tracking the performance and health of your database servers. Show execution time, CPU usage, availability, tablespace size, and other key performance metrics in real time. Visualize monitoring data in clear graphs and dashboards to identify problems more easily. Gain the overview you need to troubleshoot all kinds of issues with your database environments.
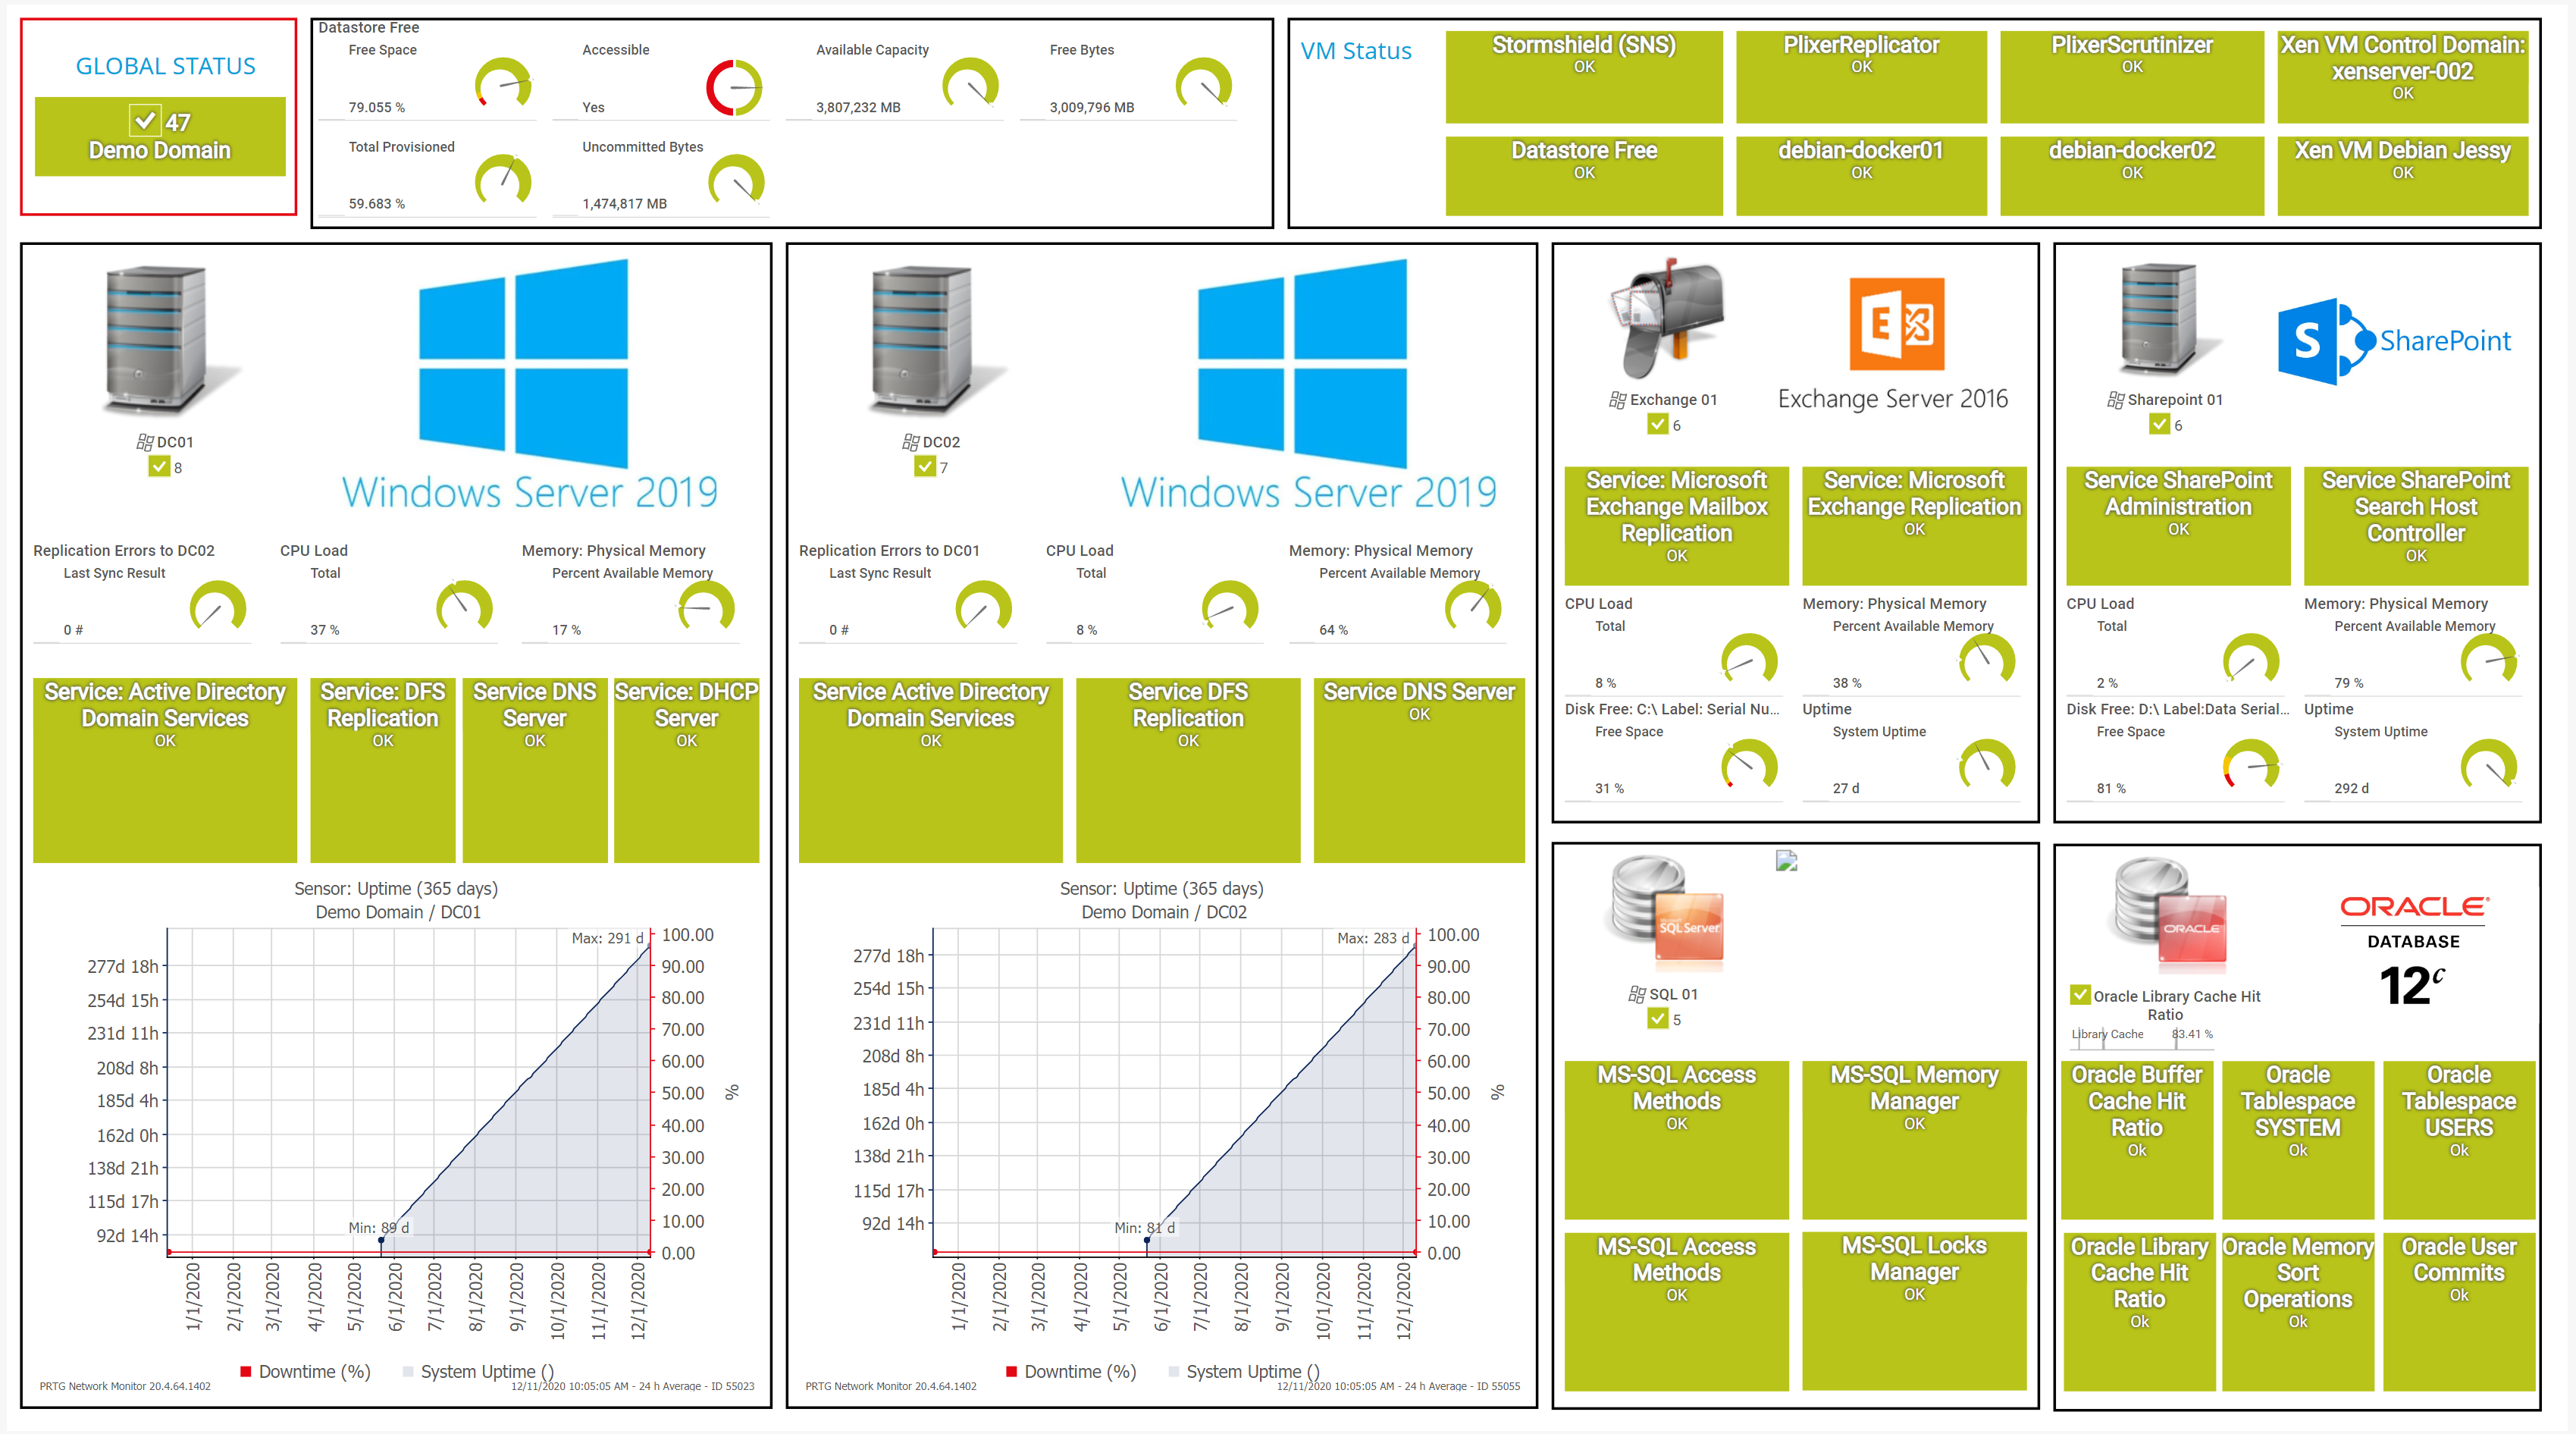
Custom PRTG map for Windows Domain Databases

Device tree view of the complete monitoring setup

Custom PRTG dashboard for keeping an eye on the entire IT infrastructure

“All-around winning
network monitor”
“The real beauty of PRTG is the endless possibilities it offers”
“PRTG Network Monitor
is very hard to beat”
Bad database performance always impacts your business-critical infrastructure. Thus, it is important to monitor database performance and database activity round the clock.
PRTG helps you check the query execution time on your database servers and notifies you in case of slow performance.
It’s no secret that databases are growing hugely over time.
Use our database monitor PRTG to make sure that you always know when database space is beginning to run low so that you can expand existing database space or set up new ones in time and prevent database crashes.
With our PRTG database monitoring software, you can easily keep an eye on various database transactions. If these transactions do not work as expected, this might also point to a problem somewhere else in your network.
To find the root cause of an issue, PRTG provides a wealth of historical data for detailed analysis.
PRTG comes with more than 250 native sensor types for monitoring your entire on-premises, cloud, and hybrid cloud environment out of the box. Check out some examples below!
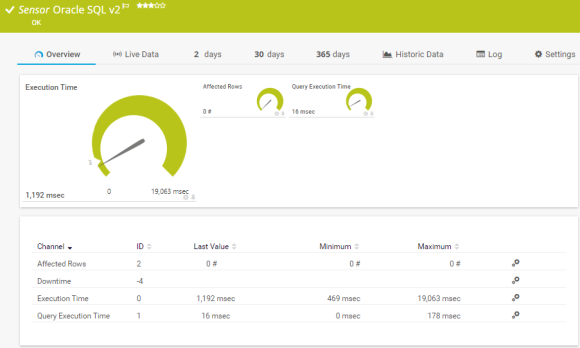
The Oracle SQL v2 sensor monitors a database on an Oracle server and executes a query. It can show the following:
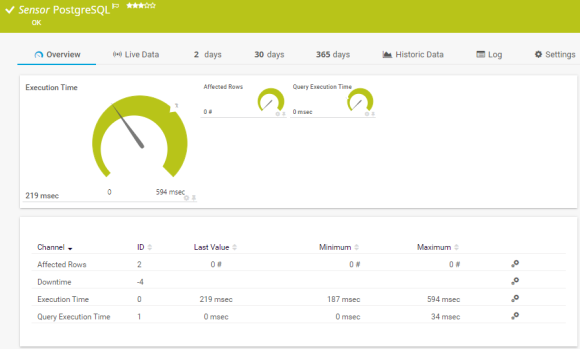
The PostgreSQL sensor monitors a database on a PostgreSQL server and executes a query. It can show the following:
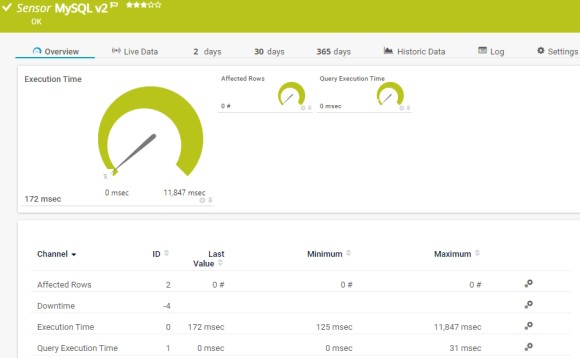
The MySQL v2 sensor monitors a database on a MySQL server and executes a query. It can show the following:
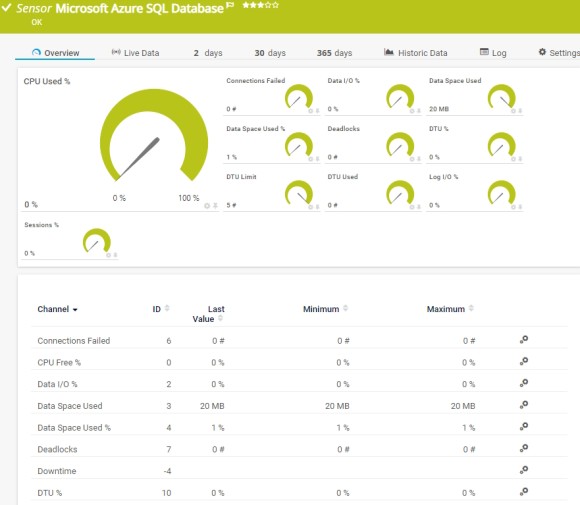
The Microsoft Azure SQL Database sensor monitors the metrics of an Azure SQL Database (single database or elastic pool) in a Microsoft Azure subscription. It can show the following:
See the PRTG Manual for a list of all available sensor types.

Custom alerts and data visualization let you quickly identify and prevent database server issues.
PRTG is set up in a matter of minutes and can be used on a wide variety of mobile devices.


“Excellent tool for detailed monitoring. Alarms and notifications work greatly. Equipment addition is straight forward and server initial setup is very easy. ...feel safe to purchase it if you intend to monitor a large networking landscape.”
Partnering with innovative IT vendors, Paessler unleashes synergies to create
new and additional benefits for joined customers.
Integrating monitoring results from PRTG into NetBrain maps makes the foundation for network automation.

Paessler and Plixer provide a complete solution adding flow and metadata analysis to a powerful network monitoring tool.

UVexplorer integrates tightly with PRTG to bring fast and accurate network discovery, detailed device inventory, and automatic network mapping to the PRTG platform.
Real-time notifications mean faster troubleshooting so that you can act before more serious issues occur.
Network Monitoring Software – Version 24.4.102.1351 (November 12th, 2024)
Download for Windows and cloud-based version PRTG Hosted Monitor available
English, German, Spanish, French, Portuguese, Dutch, Russian, Japanese, and Simplified Chinese
Network devices, bandwidth, servers, applications, virtual environments, remote systems, IoT, and more
Choose the PRTG Network Monitor subscription that's best for you

Database monitoring involves tracking and analyzing the performance, health, and activity of a database system in real-time. It helps identify and address issues such as slow queries, resource bottlenecks, and potential failures to ensure optimal database performance and reliability. Database monitoring tools often provide insights into metrics like response times, throughput, and resource utilization.
Using a database monitoring software like PRTG has several benefits, for example:
Databases can be categorized into various types based on their data model, structure, and usage. Some common types of databases include:
These categories highlight the diversity of databases, each suited to specific use cases and data management requirements.
In an SQL database, data is organized into tables, each with predefined columns and data types. SQL (Structured Query Language) is used to define, manipulate, and query the data. When a query is executed, the database management system (DBMS) interprets and optimizes the SQL statements to interact with the underlying data.
The DBMS processes queries using algorithms to efficiently retrieve, update, or delete records. Additionally, SQL databases enforce data integrity through constraints like primary keys, foreign keys, and unique constraints, ensuring consistency and reliability in the stored data.
In PRTG, “sensors” are the basic monitoring elements. One sensor usually monitors one measured value in your network, for example the traffic of a switch port, the CPU load of a server, or the free space on a disk drive. On average, you need about 5-10 sensors per device or one sensor per switch port.
Paessler conducted trials in over 600 IT departments worldwide to tune its network monitoring software closer to the needs of sysadmins. The result of the survey: over 95% of the participants would recommend PRTG – or already have.

Paessler PRTG is used by companies of all sizes. Sysadmins love PRTG because it makes their job a whole lot easier.
Bandwidth, servers, virtual environments, websites, VoIP services – PRTG keeps an eye on your entire network.
Everyone has different monitoring needs. That’s why we let you try PRTG for free.