• Company
    • About Us
    • Case Studies
    • Press Center
    • Events
    • Careers
    • Blog
    • Contact us
  • Login
 
  • English
    • Deutsch
    • Español
    • Français
    • Italiano
    • Português
Paessler
                    - The Monitoring Experts
  • Products
    • Paessler PRTG
      Paessler PRTGMonitor your whole IT infrastructure
      • PRTG Network Monitor
      • PRTG Enterprise Monitor
      • PRTG Hosted Monitor
      • PRTG extensionsExtensions for Paessler PRTGExtend your monitoring to a new level
    • Icon Features
      FeaturesExplore all monitoring features
      • Maps & dashboards
      • Alerts & notifications
      • Multiple user interfaces
      • Distributed monitoring
      • Customizable reporting
  • Solutions
    • Industries
      IndustriesMonitor various industry sectors
      • Industrial
      • Healthcare
      • Data Center
      • Education
      • Finance
      • Government
    • IT Topics
      IT TopicsMonitor all areas of IT
      • Network Monitoring
      • Bandwidth Monitoring
      • SNMP Monitor
      • Network Mapping
      • WiFi Monitoring
      • Server Monitoring
  • Pricing
  • Resources
    • Getting Started
      Getting StartedModules for self-paced learning
    • How-to Guides
      How-to GuidesGet the most out of PRTG
    • Videos & Webinars
      Videos & WebinarsLearn from Paessler experts
    • IT  Knowledge
      IT KnowledgeExpand your IT knowledge
    • PRTG Manual
      PRTG ManualFull documentation
    • Knowledge Base
      Knowledge BaseShare community knowledge
    • PRTG Sensor Hub
      PRTG Sensor HubGet sensors, scripts & templates
    • Trainings
      PRTG TrainingLearn how to work with PRTG
  • Partners
    • icon star
      New Partners and MSPBecome a new partner or MSP
    • icon partner
      Partner PortalLog in to your partner account
    • icon search
      Find a PartnerFind partners selling Paessler products
    • icon technology
      Technology AlliancesSee Paessler technology partnerships
  • Company
    • About Us
    • Case Studies
    • Press Center
    • Events
    • Careers
    • Blog
    • Contact us
  • Login
  • English
    • Deutsch
    • Español
    • Français
    • Italiano
    • Português
  • Get a quote
  • Free trial
  1. Home>
  2. IT Topics>
  3. Data Center>
  4. Data Center Infrastructure Monitoring Tool
PRTG Logo

Data Center Infrastructure Monitoring with PRTG

Maximize your data center network’s reliability, no matter the location

  • Monitor servers, routers, firewalls, PDUs, UPSs, and other hardware in your data center 24/7
  • Track both performance and environmental conditions from one place
  • Compatible with most major data center technologies, including OPC UA, Modbus, and MQTT
Free download
product overview

Our users give top ratings for monitoring with Paessler PRTG

Gartner peer insights
spiceworks
Capterra
G2
Trustpilot

PRTG data center infrastructure monitoring: What you will find on this page

Table of content
  • Streamline your data center infrastructure management with continuous monitoring
  • 4 reasons why to choose PRTG as your data center infrastructure monitoring tool
  • What data center infrastructure monitoring looks like in PRTG
  • Comprehensively monitor your data center's networking equipment and environmental conditions
  • Explore our preconfigured PRTG sensors for data center infrastructure monitoring
  • Monitoring data center infrastructure: FAQ

PRTG makes data center infrastructure monitoring as easy as it gets

Custom alerts and data visualization let you quickly identify and prevent hardware failures, environmental issues, and physical security threats.

Free download
PRODUCT OVERVIEW

Streamline your data center infrastructure management with continuous monitoring

Data center operations are the enterprise network's nerve center.

They house servers, routers, switches, power distribution units, and other network equipment that keeps your organization moving. So, with so much critical functionality riding on them, can you afford not to keep a close eye?

The answer is no, of course.

The problem is, how do you carry out hardware, software, and environmental monitoring, as well as physical security and network security monitoring effectively, especially if your data center is located thousands of miles away from your office, and there are a million and one other things on your to-do list?

Paessler PRTG is designed specifically for this purpose.

Its system of remote probes connected to a core server and preconfigured sensors for real-time monitoring of key variables streamline your workflow, bringing critical data together in one place and helping you improve your network’s operational efficiency and prevent outages.

Table of content

4 reasons why to choose PRTG as your data center infrastructure monitoring tool

settings

Effortless setup

Whether your data center is on-premises or distributed, setting up PRTG is equally straightforward: key in an IP address range, and the automatic network discovery will add every device in that range to your monitoring environment. There's no need to install specialized software agents or clients.

centralized and monitored

All-in-one monitoring

A single, unified view of your entire IT infrastructure. PRTG's preconfigured sensors can track every hardware, application, and environmental parameter you can think of, including whether there's been unauthorized access to your server rooms or data centers.

boost

Greater network stability

Don't let issues in your data center disrupt your whole organization. PRTG tracks key variables in real time, making it easier to optimize performance and carry out capacity planning. You'll also get alerted about potential issues, so you can fix them and prevent unplanned downtime.

save money

Lower energy costs

Nobody likes energy waste (especially if you have to listen to accounts complain about how high your operating costs are). Track energy consumption and other metrics that impact how much power your IT infrastructure uses in real time, and do more with less – for more sustainability.

What data center infrastructure monitoring looks like in PRTG

Diagnose network issues by continuously tracking the health and performance of your data center’s hardware, applications, services, and entire infrastructure. Show power consumption, temperature, humidity, building access, unusual network activity, and other key metrics in real time. Visualize data collection in clear graphs and dashboards to identify problems more easily. Gain the overview you need to troubleshoot energy usage spikes, capacity constraints, access vulnerabilities, and other performance and security issues.

prtg screenshot map kentix data center

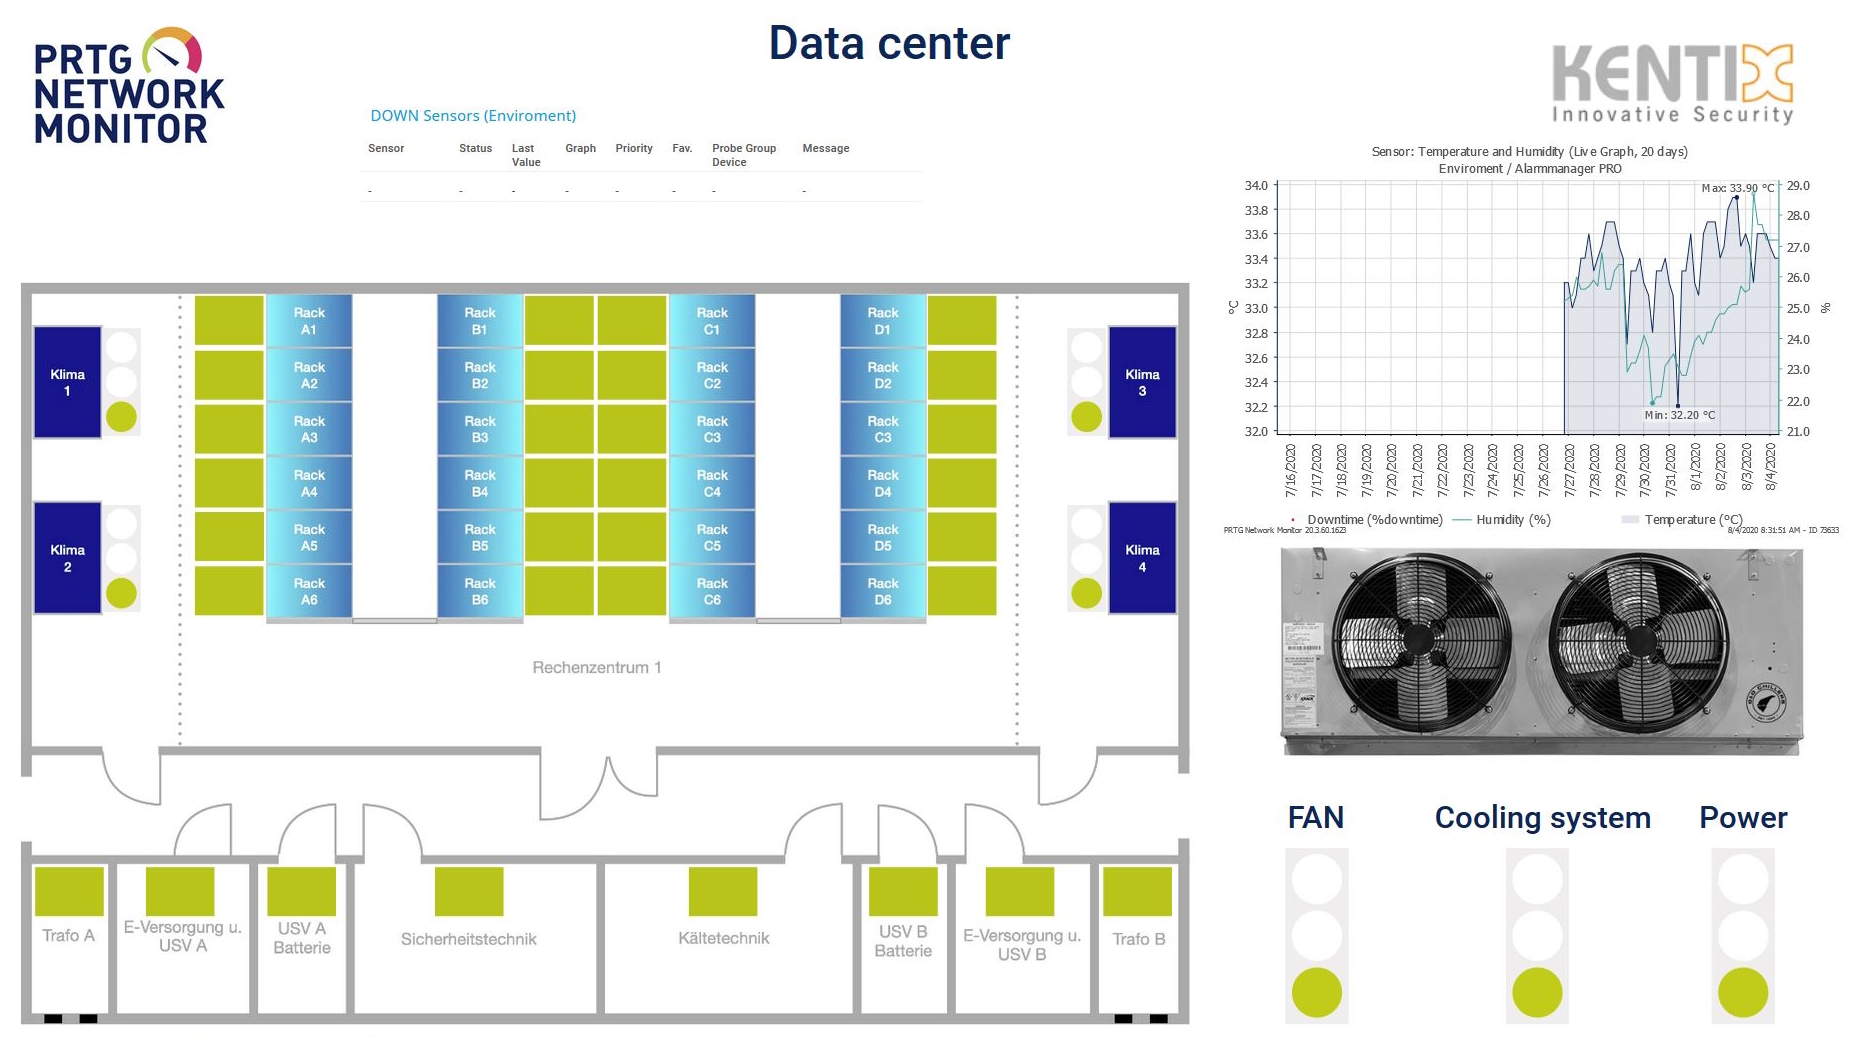
Map of a Kentix data center in PRTG

prtg screenshot map rittal datacenter

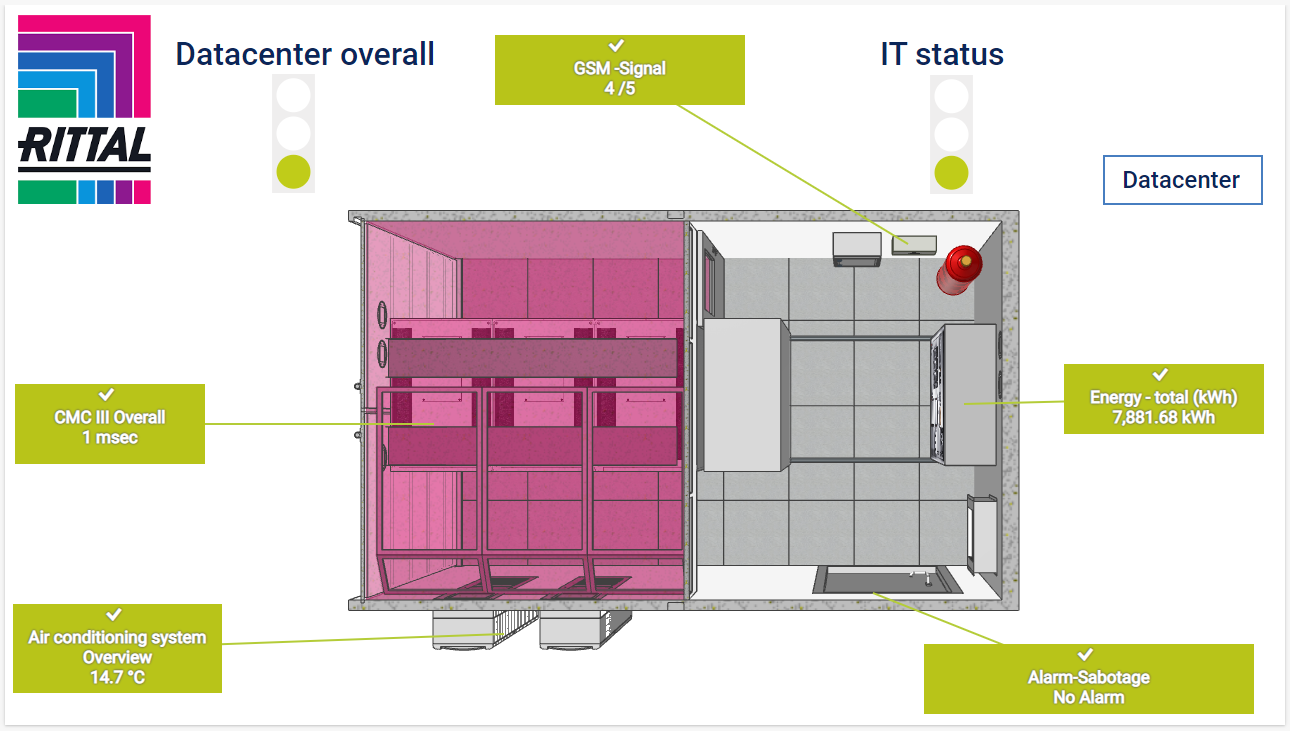
Map of a Rittal data center in PRTG

PRTG Screenshot device tree view

Device tree view of the complete monitoring setup

PRTG screenshot map entire it infrastructure

Custom PRTG dashboard for keeping an eye on the entire IT infrastructure

PRTG screenshot graph live data traffic

Live traffic data graph in PRTG

Start monitoring data center infrastructure with PRTG and see how it can make your network more reliable and your job easier.

Free download
PRODUCT OVERVIEW

IT experts agree: Paessler PRTG is a great solution for IT infrastructure monitoring

PCMag

“All-around winning
 network monitor”

IT Brief

“The real beauty of PRTG is the endless possibilities it offers”

ITPro

“PRTG Network Monitor 
is very hard to beat”

Comprehensively monitor your data center's networking equipment and environmental conditions

workstation

Hardware asset management

Our data center monitoring software’s sophisticated, preconfigured sensors collect critical real-time data from every hardware component in your data center:

  • PDUs, and UPSs
  • IoT devices
  • Servers, routers, firewalls, and switches
  • Server racks and enclosures
  • Workstations
temperature

Environmental parameters

Because environmental conditions are as critically-important as performance metrics for your data center to function smoothly, PRTG also monitors key environmental variables:

  • Internal and external humidity
  • Fan and PCIe device system health and power monitoring, including voltage, input and output watts, energy efficiency, and thermal status
  • Air conditioning unit workload and performance and availability

Pick your preferred thresholds, and PRTG’s built-in automations alert you if performance falls under or over, so you can troubleshoot issues, optimize connectivity, and maximize network uptime

Explore our preconfigured PRTG sensors for data center infrastructure monitoring

PRTG comes with more than 250 native sensor types for monitoring your entire on-premises, cloud, and hybrid cloud environment out of the box. Check out some examples below!

SNMP Rittal CMC III Hardware Status

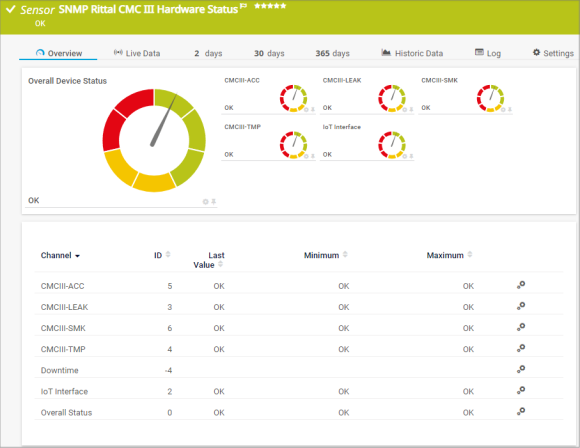
The SNMP Rittal CMC III Hardware Status sensor monitors the overall status of Rittal data center hardware, for example Rittal Computer Multi Control version 3 (CMC III) processing units, Rittal power distribution units (PDU), or Rittal IoT interfaces. It can show the following:

  • Overall device status
  • Attached external sensor status
SNMP Rittal CMC III Hardware Status

SNMP interSeptor Pro Environment

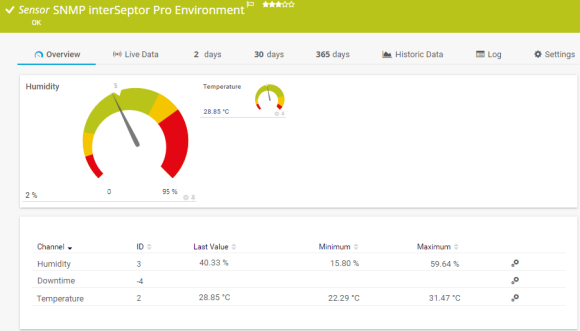
The SNMP interSeptor Pro Environment sensor queries data from a Jacarta interSeptor Pro environmental monitoring system. It can show the following:

  • Humidity
  • Temperature
SNMP interSeptor Pro Environment

OPC UA Server Status

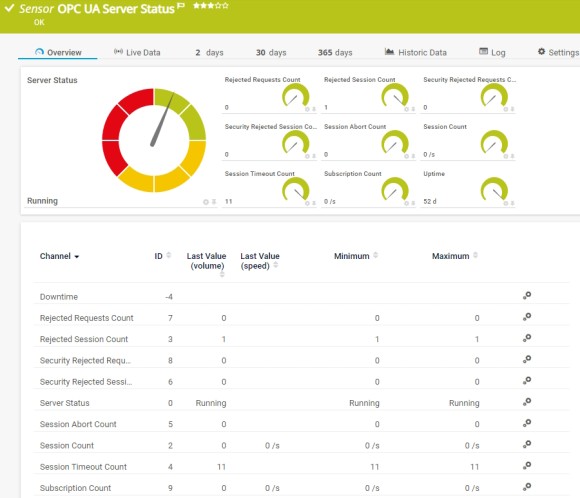
The OPC UA Server Status sensor monitors the server status, uptime, and diagnostic information of an OPC Unified Architecture (OPC UA) server. It can show the following:

  • Server status
  • Uptime
  • Number of rejected requests and sessions
  • Number of security-rejected requests and sessions
  • Number of subscriptions, sessions, session timeouts, and session aborts
OPC UA Server Status

Redfish Power Supply

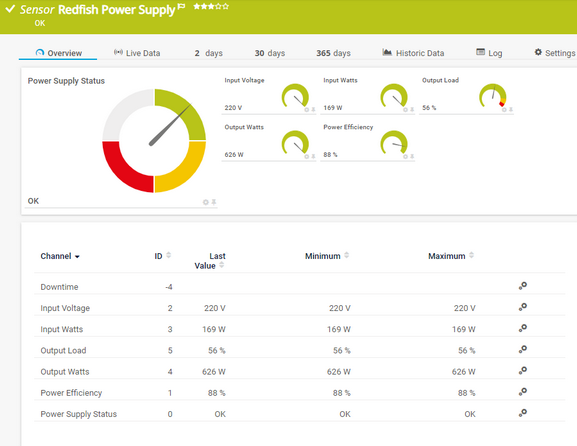
The Redfish Power Supply sensor monitors the power supply of a Redfish Scalable Platforms Management API (Redfish)-capable server. It can show the following:

  • Input voltage
  • Input and output watts
  • Output load
  • Power efficiency
  • Power supply status
Redfish Power Supply

See the PRTG Manual for a list of all available sensor types.

PRTG is compatible with all major vendors, products, and systems

compatible with all major vendors, products, and systems

Find the root cause of the problem with our PRTG data center infrastructure monitoring solution

Real-time notifications mean faster troubleshooting so that you can act before more serious issues occur.

Free download
PRODUCT OVERVIEW

“In all our tests, PRTG was significantly more reliable and, above all, faster than classic DCIM solutions. We need a solution that gives us a real-time overview of the status of all the data centers we monitor and does not make us wait for what feels like minutes with every click. With PRTG, we have found that solution.”

Ronald Kok, CEO
All IT Rooms

“PRTG is an easy-to-use and comprehensive solution to monitor our Industrial Automation DataCenter (IADC)”

Benjamin Lauterlein, Product Manager
Siemens AG

“We went to the market and looked for a tool that was cost effective, but more importantly, could monitor most or all the items in the data center. PRTG was this tool.”

Lydia Muzar
CLICK-into

Your data center infrastructure monitoring monitor at a glance – even on the go

PRTG is set up in a matter of minutes and can be used on a wide variety of mobile devices.

device overview
Gartner peer insights

“Excellent tool for detailed monitoring. Alarms and notifications work greatly. Equipment addition is straight forward and server initial setup is very easy. ...feel safe to purchase it if you intend to monitor a large networking landscape.”

Read the complete review at Gartner Peer Insights

Create innovative solutions with Paessler’s IT partners

Partnering with innovative IT vendors, Paessler unleashes synergies to create
new and additional benefits for joined customers.

Martello

Martello 

By integrating PRTG with Martello iQ, you can add a fast analytics layer to improve uptime, visualize your IT environment, and integrate all of your IT systems into a single pane of glass.

Read more
Rittal

Rittal

IT that works constitutes a business-critical basis for a company's success. Availability and security must be defined for the respective purpose and closely monitored – by OT and IT alike.

Read more
Siemon

Siemon

Siemon and Paessler bring together intelligent building technology and advanced monitoring and make your vision of intelligent buildings and data centers become reality.

Read more

Find the root cause of the problem with our PRTG data center infrastructure monitoring solution

Real-time notifications mean faster troubleshooting so that you can act before more serious issues occur.

Free download
PRODUCT OVERVIEW
Paessler PRTG

Paessler PRTG

Network Monitoring Software – Version 24.4.102.1351 (November 12th, 2024)

Hosting icon

Hosting

Download for Windows and cloud-based version PRTG Hosted Monitor available

Languages icon

Languages

English, German, Spanish, French, Portuguese, Dutch, Russian, Japanese, and Simplified Chinese

test

Monitor everything

Network devices, bandwidth, servers, applications, virtual environments, remote systems, IoT, and more

test

Pricing

Choose the PRTG Network Monitor subscription that's best for you

Discover more monitoring insights and stories

Resources Solution

Solutions for all your monitoring needs

  • Enterprise Network Monitoring
  • SAP monitoring
  • Application monitoring
Resources Content

Powerful stories from the monitoring world

  • Customer success story ESA & PRTG
  • What is SaaS? Definition and Details
  • Customer success story Gris Group & PRTG
Resources Solutions

Resources to master your monitoring challenges

  • Introduction: Monitoring with PRTG
  • Using PRTG for automated inventory tracking
  • Monitor failed logins via Event Viewer

Monitoring data center infrastructure: FAQ


What's PRTG data center infrastructure monitoring?

PRTG is a proprietary software tool that tracks the health and performance of servers, fans, cooling systems, power distribution units (PDUs), USPs, and other network devices, as well as important environmental metrics such as airflow and air pressure, temperature, and humidity. Available for Windows-based on-premises servers or as a cloud-hosted solution, it's capable of monitoring unlimited local, remote, and virtual devices, bringing critical system data together in one simple, intuitive interface you can access from anywhere: at the office, at home, or on the go.

What does the infrastructure of a typical data center look like?

A data center is usually made up of the following:

  • Server room: The server room is home to the primary IT infrastructure, i.e., hardware such as servers and server racks, and sometimes the telephone system. Since the servers are close together, this room must be cooled.
  • Room for supporting technology and technical equipment: Server rooms must be protected from excess heat and humidity. Among other things, the technical room therefore contains an air-conditioning system that cools the server room, the uninterruptible power supply (UPS), and fire-extinguishing equipment.
  • Technical and organizational protection measures: Server rooms must also be protected against dirt, fire, flooding, and unauthorized access. Technical protection measures include airlocks, security cameras, and smoke-proof doors and windows, which should also be secured against burglars. Access to the server room is usually controlled by guidelines and access controls.
Why should I monitor data center infrastructure?

For lots of reasons. It improves your network's performance and reliability. It prevents avoidable downtime. It strengthens security. It ensures your IT infrastructure’s environmental conditions are appropriate. And, ultimately, it saves your organization time and money. But don't take our word for it. Over 95% of our customers would very likely, definitely, or have already recommended PRTG.

My organization has a distributed data center and colocation. Can I still use PRTG?

Yes. PRTG’s system of probes enable it to carry out remote monitoring of any device, even if it’s located 1000 miles away, so it's ideal for organizations that have distributed IT infrastructure. Set up remote probes close to the endpoints of the network devices or physical infrastructure you want to monitor, and PRTG will gather the performance data for you in one place.

What is a sensor in PRTG?

In PRTG, “sensors” are the basic monitoring elements. One sensor usually monitors one measured value in your network, for example the traffic of a switch port, the CPU load of a server, or the free space on a disk drive. On average, you need about 5-10 sensors per device or one sensor per switch port.

We asked: would you recommend PRTG? Over 95% of our customers say yes!

Paessler conducted trials in over 600 IT departments worldwide to tune its network monitoring software closer to the needs of sysadmins. The result of the survey: over 95% of the participants would recommend PRTG – or already have.

recommendation

Still not convinced?

Love

More than 500,000 sysadmins love PRTG

Paessler PRTG is used by companies of all sizes. Sysadmins love PRTG because it makes their job a whole lot easier.

PRTG

Monitor your entire IT infrastructure

Bandwidth, servers, virtual environments, websites, VoIP services – PRTG keeps an eye on your entire network.

test

Try Paessler PRTG for free

Everyone has different monitoring needs. That’s why we let you try PRTG for free.

PRTG Logo

Start data center infrastructure monitoring with PRTG and see how it can make your network more reliable and your job easier.

Free download
PRODUCT OVERVIEW

Products

  • Paessler PRTG
    Paessler PRTGMonitor your whole IT infrastructure
    • PRTG Network Monitor
    • PRTG Enterprise Monitor
    • PRTG Hosted Monitor
  • PRTG extensions
    Extensions for Paessler PRTGExtend your monitoring to a new level
  • Icon Features
    FeaturesExplore all monitoring features

Monitoring with PRTG

  • Network monitoring
  • Bandwidth monitoring
  • SNMP monitoring
  • Network mapping
  • Wi-Fi monitoring
  • Server monitoring
  • Network traffic analyzer
  • NetFlow monitoring
  • Syslog server

Useful Links

  • PRTG Manual
  • Knowledge Base
  • Customer Success Stories
  • About Paessler
  • Subscribe to newsletter
  • PRTG Support
  • PRTG Consulting

Contact

Paessler GmbH
Thurn-und-Taxis-Str. 14, 
90411 Nuremberg 
Germany

[email protected]

+49 911 93775-0

  • Contact us
©2025 Paessler GmbHTerms & ConditionsPrivacy PolicyImprintReport VulnerabilityDownload & InstallSitemap
PRTG Hosted Monitor PRTG Hosted Monitor PRTG Hosted Monitor