Custom alerts and data visualization let you quickly identify and prevent application performance and downtime issues.
Have cloud-based services also changed the way your company thinks about and implements infrastructure or software development? You’re not alone. The cloud-native way of working and thinking is here to stay. That’s why we’ve developed Paessler PRTG to keep all of your monitoring data in one place. Whether it’s private cloud data, AWS, Microsoft Azure, or others, we’ve got you covered.
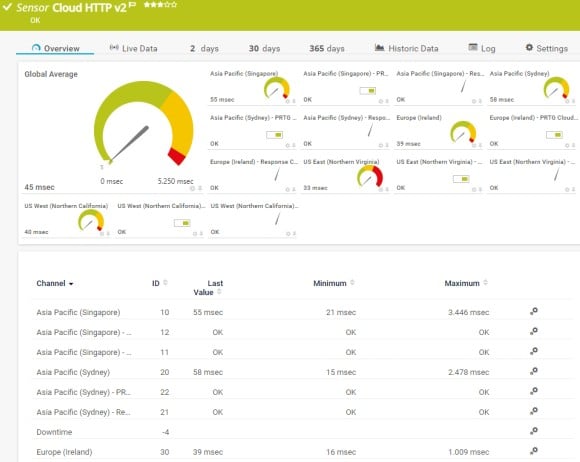
You use different cloud computing services in locations all around the world? With PRTG’s preconfigured Cloud HTTP v2 sensor, you only need one monitoring tool to check service accessibility and keep an eye on your web server locations’ response times from all over the world.
Additionally, the Common SaaS sensor provides the response times of several common SaaS providers, so you can always make decisions based on the latest data.
Our AWS monitoring keeps you up to date with the latest data from all your AWS accounts, retrieved directly via the Amazon CloudWatch API. This lets you see the most important metrics at a glance and gives you the best possible starting point for decision-making.
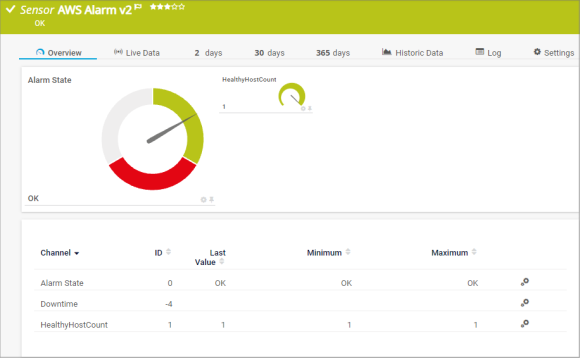
PRTG comes with preconfigured AWS sensors out of the box, like the AWS Alarm v2, the AWS Cost sensor, or the AWS EBS v2 and AWS RDS v2 sensors to check the performance of your cloud services.
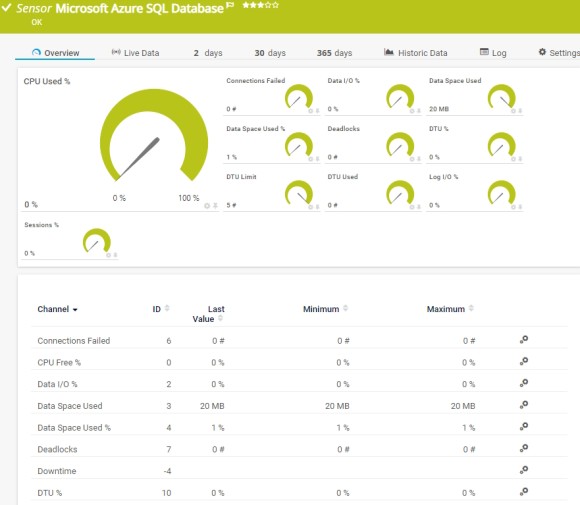
You know how important an unobstructed view of your most important data is when you host services in a public cloud like Azure. The Microsoft Azure Virtual Machine or the Microsoft Azure SQL Database sensor, for example, provide you with 24/7 observability of all your cloud applications.
So it’s safe to say: with PRTG Microsoft Azure sensors you can, but don’t have to, configure anything yourself – you can get started right away.
Diagnose network issues by continuously tracking cloud-based services. Show multi-cloud parameters, cloud performance and other key metrics in real time. Visualize monitoring data in clear graphs and dashboards to identify problems more easily. Gain the overview you need to troubleshoot your cloud infrastructure.

Device tree view of the complete monitoring setup
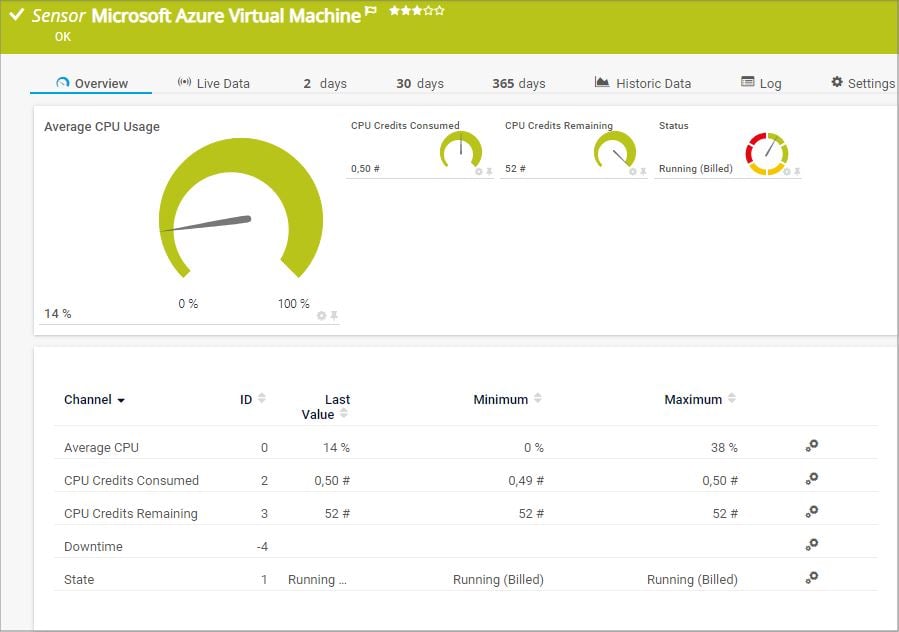
Preconfigured Microsoft Azure Virtual Machine sensor in PRTG

Custom PRTG dashboard for keeping an eye on the entire IT infrastructure
“All-around winning
network monitor”
“The real beauty of PRTG is the endless possibilities it offers”
“PRTG Network Monitor
is very hard to beat”
Boost the observability of your cloud resources to new heights with our expert software for monitoring cloud services. Whether you’re tracking VMs, uptime, or cloud-based applications, you have all key performance metrics you need for the optimization of your business processes. And that’s just the start.
What's better than real-time alerts? Customizable real-time alerts you can tailor to your exact needs, of course. Only a certain group of people need to be alerted? Done. Alerts that flag vulnerabilities need to be delivered to different devices? Done.
Because you don't need to have a PC nearby to get alerted. The PRTG apps for iOS and Android keep everyone informed, wherever they are.
While you’re looking for a comprehensive monitoring software that covers everything, you might end up finding one tool for network monitoring, one for website monitoring, and another that watches your cloud operations. But don’t worry, PRTG can handle all of it and so much more.
Reliable hardware monitoring? We’ve got you covered. You also want to integrate your entire OT infrastructure in addition to your IT infrastructure? Then you should definitely check out PRTG.
Do you want to spend hours setting up your monitoring environment? We don’t. That’s why PRTG has pretty neat automation features which ensure you have PRTG up and running in a matter of minutes.
Thanks to useful out-of-the-box templates and dashboards, as well as the convenient auto-discovery function, your monitoring is set up with just a few clicks.
As monitoring specialists, you have different stakeholders that you have to report to. Nothing new here. That you don’t have to create every report yourself or install an additional module, PRTG not only collects data, but also has a built-in reporting feature.
You will have your data prepared exactly as your stakeholders need it. All your decisions going forward will be based purely on the data you collect.
PRTG comes with more than 250 native sensor types for monitoring your entire on-premises, cloud, and hybrid cloud environment out of the box. Check out some examples below!
The AWS Alarm v2 sensor monitors the status of an Amazon Web Services (AWS) alarm by reading its data from Amazon CloudWatch via the AWS API. It can show the following:
The Cloud HTTP v2 sensor monitors the loading time of a web server via HTTP from different locations worldwide (Asia Pacific: Singapore, Asia Pacific: Sydney, Europe: Ireland, US East: Northern Virginia, US West: Northern California) via the PRTG Cloud. It can show the following:
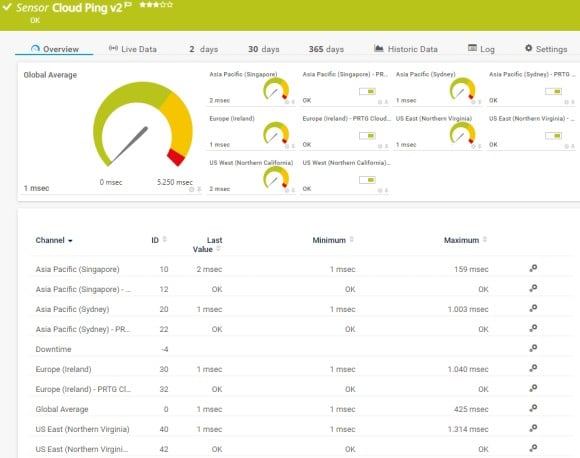
The Cloud Ping v2 sensor monitors the Transmission Control Protocol (TCP) ping times to its parent device from different locations worldwide (Asia Pacific: Singapore, Asia Pacific: Sydney, Europe: Ireland, US East: Northern Virginia, US West: Northern California) via the PRTG Cloud. It can show the following:
The Microsoft Azure SQL Database sensor monitors the metrics of an Azure SQL Database (single database or elastic pool) in a Microsoft Azure subscription. It can show the following:
See the PRTG Manual for a list of all available sensor types.
Real-time notifications mean faster troubleshooting so that you can act before more serious issues occur.

It’s no secret then when you use cloud computing services like AWS, Microsoft Azure, or Google Cloud, you produce a lot of data. To stay on top of things and make quick, educated evaluations, you need a comprehensive cloud monitoring tool. That’s where PRTG takes the stage.
It is your single-pane-of-glass, detailed cloud monitoring software. Say goodbye to juggling different tools. With PRTG, you can monitor all your accounts from all IaaS providers in one place.
No matter if they’re in the software department, HR, or the finance department, your specialists need software that is perfectly matched to their tasks if they are going to work at their best. This specialized software is often only offered as SaaS.
Since the software isn’t installed locally on your servers and systems, it’s even more important to keep an eye on things. Count on PRTG’s cloud application monitoring and its quality-of-life features.
Developing new applications is becoming increasingly complex. To reach as many end users as possible, you must develop for a lot of different platforms. Cloud providers offer great platform-as-a-service options that make it easier to test various environments and integrations quickly.
However, this can also lead to unexpected issues. With PRTG, you can easily identify and resolve these problems, whether it's a hardware error, a hybrid cloud issue, or something else entirely.
Custom alerts and data visualization let you quickly identify and prevent application performance and downtime issues.
PRTG is set up in a matter of minutes and can be used on a wide variety of mobile devices.

Paessler is a certified partner in the Amazon Web Services ecosystem, which includes a growing community of software vendors who are building solutions on cloud computing.
What does this mean for you?
Partnering with innovative IT vendors, Paessler unleashes synergies to create
new and additional benefits for joined customers.
Axis offers one of the most complete and reliable product portfolios, an expanded professional network, and comprehensive integration support for video management software.

Monitor all major physical hazards in IT rooms and racks such as critical climate factors, fire or burglary.
Combine the functionality of Sigfox and Paessler for the most comprehensive, cost-effective, and easy-to-use IoT solution available.
Real-time notifications mean faster troubleshooting so that you can act before more serious issues occur.
Network Monitoring Software – Version 24.4.102.1351 (November 12th, 2024)
Download for Windows and cloud-based version PRTG Hosted Monitor available
English, German, Spanish, French, Portuguese, Dutch, Russian, Japanese, and Simplified Chinese
Network devices, bandwidth, servers, applications, virtual environments, remote systems, IoT, and more
Choose the PRTG Network Monitor subscription that's best for you
Cloud services monitoring is the process of tracking and analyzing the performance, availability, and health of cloud-based services and infrastructure.
This involves monitoring metrics such as CPU usage, network performance, and resource utilization to ensure optimal operation and to identify potential problems. Effective monitoring helps maintain data integrity and enables proactive management of cloud environments.
Monitoring cloud services is essential for maintaining the efficiency and reliability of your cloud infrastructure. It allows you to detect anomalies early, resulting in optimal network performance and resource utilization.
By continuously monitoring metrics such as CPU usage and application response times, businesses can quickly identify the root cause of issues, minimize downtime, and ensure data integrity. This is particularly crucial for DevOps teams, who rely on real-time data to optimize and manage cloud environments.
It is essential for organizations to monitor key metrics in cloud services, including CPU usage, memory utilization, network performance, and storage I/O. Additionally, monitoring tools should track application performance, user activity, and data transfer rates.
By keeping an eye on these metrics, organizations can utilize their resources efficiently. Monitoring these parameters helps in identifying the root cause of issues, to get a swift resolution and maintain the overall system health.
Monitoring cloud services is an integral part of DevOps practices, as it provides continuous feedback on the performance and health of cloud environments. Monitoring tools offer real-time data on CPU usage, network performance, and resource utilization, which are essential for optimizing deployments and automating workflows.
By identifying potential issues early, monitoring supports the DevOps goal of rapid and reliable software delivery, ensuring that applications run smoothly and efficiently.
In PRTG, “sensors” are the basic monitoring elements. One sensor usually monitors one measured value in your network, for example the traffic of a switch port, the CPU load of a server, or the free space on a disk drive. On average, you need about 5-10 sensors per device or one sensor per switch port.
Paessler conducted trials in over 600 IT departments worldwide to tune its network monitoring software closer to the needs of sysadmins. The result of the survey: over 95% of the participants would recommend PRTG – or already have.

Paessler PRTG is used by companies of all sizes. Sysadmins love PRTG because it makes their job a whole lot easier.
Bandwidth, servers, virtual environments, websites, VoIP services – PRTG keeps an eye on your entire network.
Everyone has different monitoring needs. That’s why we let you try PRTG for free.