• Company
    • About Us
    • Case Studies
    • Press Center
    • Events
    • Careers
    • Blog
    • Contact us
  • Login
 
  • English
    • Deutsch
    • Español
    • Français
    • Italiano
    • Português
Paessler
                    - The Monitoring Experts
  • Products
    • Paessler PRTG
      Paessler PRTGMonitor your whole IT infrastructure
      • PRTG Network Monitor
      • PRTG Enterprise Monitor
      • PRTG Hosted Monitor
      • PRTG extensionsExtensions for Paessler PRTGExtend your monitoring to a new level
    • Icon Features
      FeaturesExplore all monitoring features
      • Maps & dashboards
      • Alerts & notifications
      • Multiple user interfaces
      • Distributed monitoring
      • Customizable reporting
  • Solutions
    • Industries
      IndustriesMonitor various industry sectors
      • Industrial
      • Healthcare
      • Data Center
      • Education
      • Finance
      • Government
    • IT Topics
      IT TopicsMonitor all areas of IT
      • Network Monitoring
      • Bandwidth Monitoring
      • SNMP Monitor
      • Network Mapping
      • WiFi Monitoring
      • Server Monitoring
  • Pricing
  • Resources
    • Getting Started
      Getting StartedModules for self-paced learning
    • How-to Guides
      How-to GuidesGet the most out of PRTG
    • Videos & Webinars
      Videos & WebinarsLearn from Paessler experts
    • IT  Knowledge
      IT KnowledgeExpand your IT knowledge
    • PRTG Manual
      PRTG ManualFull documentation
    • Knowledge Base
      Knowledge BaseShare community knowledge
    • PRTG Sensor Hub
      PRTG Sensor HubGet sensors, scripts & templates
    • Trainings
      PRTG TrainingLearn how to work with PRTG
  • Partners
    • icon star
      New Partners and MSPBecome a new partner or MSP
    • icon partner
      Partner PortalLog in to your partner account
    • icon search
      Find a PartnerFind partners selling Paessler products
    • icon technology
      Technology AlliancesSee Paessler technology partnerships
  • Company
    • About Us
    • Case Studies
    • Press Center
    • Events
    • Careers
    • Blog
    • Contact us
  • Login
  • English
    • Deutsch
    • Español
    • Français
    • Italiano
    • Português
  • Get a quote
  • Free trial
  1. Home>
  2. IT Topics>
  3. Network>
  4. Availability Monitoring Tool
PRTG Logo

Availability Monitoring with PRTG

Track your entire network and enjoy up to 99.999% uptime

  • Benefit from 24/7 monitoring of your entire IT infrastructure
  • High availability monitoring of servers, website, network, apps & more
  • Customized alerts help you take action to prevent crashes
Free download
product overview

Our users give top ratings for monitoring with Paessler PRTG

Gartner peer insights
spiceworks
Capterra
G2
Trustpilot

PRTG availability monitoring: What you will find on this page

Table of content
  • Save time & money with up to 99.999% availability with PRTG
  • Availability & uptime monitoring for every use case with PRTG
  • What availability monitoring looks like in PRTG
  • 5 reasons why PRTG is the availability monitoring tool of your choice
  • Explore our preconfigured PRTG sensors for availability monitoring
  • Availability Monitoring: FAQ

PRTG makes availability monitoring as easy as it gets

Custom alerts and data visualization let you quickly identify and prevent network availability and performance issues.

Free download
PRODUCT OVERVIEW

Save time & money with up to 99.999% availability with PRTG

What’s the difference between 99% availability and 99.999% availability?

  • Over 87 hours of downtime
  • Many headaches, wasted time, and lost productivity
  • Up to €640,000 or $700,000 in costs and lost revenue*


With Paessler PRTG, many customers reduce downtime to 5 minutes or less per year with 99.999% availability of their website, servers, and databases. Here’s a breakdown of the potential impact of PRTG on your business:

  • 99% availability = 87.7 hours of downtime per year
  • 9% availability = 8.45 hours of downtime per year
  • 99% availability = 52 minutes of downtime per year
  • 999% availability = 5 minutes or less of downtime per year


*According to a study by Techconsult, one hour of downtime costs medium-sized companies between €20,000 and €40,000, or between $21,000 and $42,000. The companies in the study had an average of four crashes per year, with each crash lasting an average of 3.8 hours. The total costs therefore amount to €320,000 to €640,000 per year (up to $700,000) for medium-sized companies with 200 to 5,000 employees.

Table of content

Availability & uptime monitoring for every use case with PRTG

The email-server is down, the telephone won't stop ringing. Everyone is calling, although the downtime has lasted for six minutes only. But the stress and short-term work loss are immense. Calculated over the course of a year, this costs a huge amount of money. That's where PRTG comes in: our monitoring software paves the way to high availability.

Website availability

Every system failure means lost sales and customer complaints. PRTG includes the Ping v2 sensor for website monitoring to help you avoid crashes and ensure website connectivity.

Plus, the Cloud Ping v2 and Cloud HTTP v2 sensors monitor the availability of your website from a number of different locations around the globe.

Email availability

If your mail server is down, the backbone of your communication is broken. PRTG comes with POP3, IMAP, and SMTP sensors to monitor the availability of your mail server.

To check whether emails are delivered and how long they need to arrive at their destination, you can use our two email round trip sensors.

Server availability

No matter if you want to keep an eye on the availability of your hardware (database servers, file servers, storage servers,…) virtual servers, or other endpoints, PRTG server monitoring has got you covered.

With the Ping v2 sensor, you can even reduce alert noise – as soon as a server is not reachable anymore, PRTG sends an alert and automatically pauses all other sensors in the dependency.

Bandwidth availability

PRTG is the perfect tool for SLA monitoring, for example, if you want to know if your service provider is actually delivering the amount of bandwidth that was promised.

In fact, PRTG includes sensors for almost every available technology for monitoring bandwidth usage, for example SNMP, packet sniffing, and flow (NetFlow, jFlow, sFlow, and IPFIX).

Network availability

With PRTG, you'll enjoy a 24/7 overview of your entire network. Monitor the availability of all systems, devices, applications, and services – on-premises, in the cloud, or in virtualized environments.

We even throw in a failover cluster to ensure the availability of your monitoring in the event of a PRTG server crash or network outage.

What availability monitoring looks like in PRTG

Diagnose network issues by continuously tracking the availability of your servers, applications, webpages, IT services, operating systems, and more. Show the reachability of all your network’s components and other key metrics in real time. Visualize monitoring data in clear graphs and dashboards to identify problems more easily. Gain the overview you need to troubleshoot costly downtime.

PRTG Screenshot device tree view

Device tree view of the complete monitoring setup

PRTG screenshot map entire it infrastructure

Custom PRTG dashboard for keeping an eye on the entire IT infrastructure

PRTG screenshot graph live data traffic

Live traffic data graph in PRTG

Start monitoring the availability of your network devices with PRTG and see how it can make your network more reliable and your job easier.

Free download
PRODUCT OVERVIEW

IT experts agree: Paessler PRTG is a great solution for IT infrastructure monitoring

PCMag

“All-around winning
 network monitor”

IT Brief

“The real beauty of PRTG is the endless possibilities it offers”

ITPro

“PRTG Network Monitor 
is very hard to beat”

5 reasons why PRTG is the availability monitoring tool of your choice

All-in-one network monitoring

With PRTG, you get a centralized network monitoring solution that covers your entire IT infrastructure. With one single dashboard, you can monitor your entire network or only specific network devices. PRTG simplifies your day-to-day work, and its configuration and setup are quick and easy.

Custom alerts & notifications

PRTG comes with a customizable, built-in notification system. When problems arise, you’ll immediately be alerted via email, SMS, push notification, or other methods so you can take action before the performance of your system is affected.

Comprehensive reporting

PRTG features a customizable and comprehensive reporting system which gives you a reliable data base for your long-term planning. With PRTG, you’ll shed light on the causes and consequences of failures and document the load of your network.Tell the reader more

Customizable visualization

PRTG not only displays your entire monitoring setup on an easy-to-read dashboard, but also offers the possibility to create custom network maps and dashboards using our drag-and-drop widget editor. This way, you can quickly visualize the availability of your systems the way you need.

Network performance & security

Along with hardware, PRTG also monitors your available bandwidth and network traffic so you can keep a constant eye on the performance of your network. While PRTG is not a security tool, you can also monitor open and closed ports to help recognize suspicious traffic and improve security.

Explore our preconfigured PRTG sensors for availability monitoring

PRTG comes with more than 250 native sensor types for monitoring your entire on-premises, cloud, and hybrid cloud environment out of the box. Check out some examples below!

Ping v2

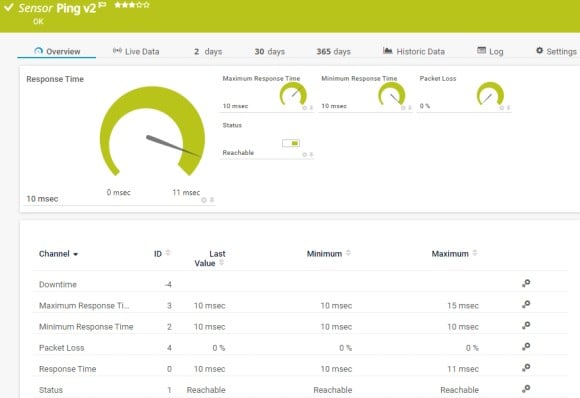
The Ping v2 sensor sends an Internet Control Message Protocol (ICMP) echo request ("ping") from the probe system to the parent device to monitor its availability. It can show the following:

• Response time

• Packet loss

• Target status

• Minimum and maximum ping time

Ping v2
Ping v2

Cloud Ping v2

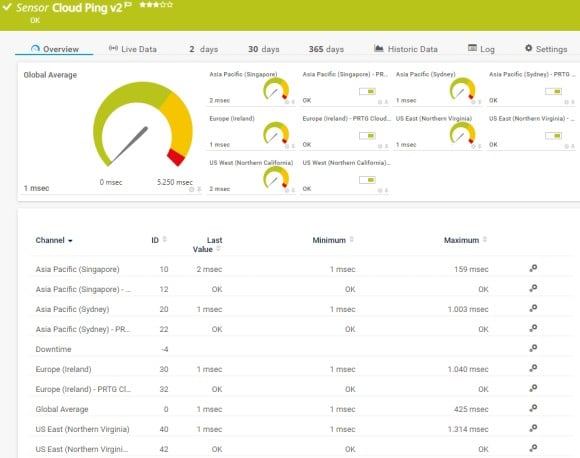
The Cloud Ping v2 sensor monitors the Transmission Control Protocol (TCP) ping times to its parent device from different locations worldwide (Asia Pacific: Singapore,  Asia Pacific: Sydney, Europe: Ireland, US East: Northern Virginia,  US West: Northern California) via the PRTG Cloud. It can show the following:

  • Average global response time
  • Response time of the target server at the location
  • If the PRTG Cloud query was successful or not
g_v2_sensor">Cloud Ping v2

SNMP Uptime v2

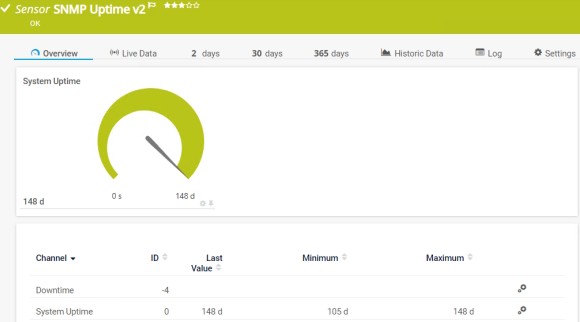
The SNMP Uptime v2 sensor monitors the uptime of a device. It can show the following:

  • Downtime
  • System uptime
SNMP Uptime v2
SNMP Uptime v2

Windows System Uptime

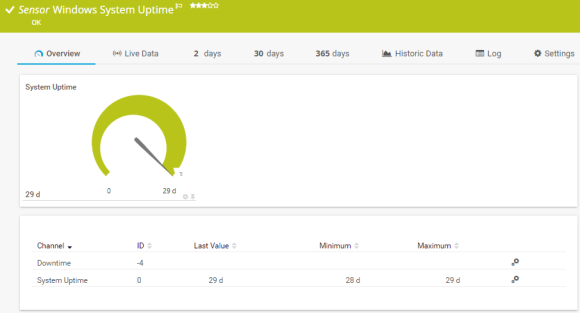
The Windows System Uptime sensor monitors the uptime of a Windows system via Windows Management Instrumentation (WMI) or Windows performance counters. It can show the following:

  • Downtime
  • System uptime
Windows System Uptime

See the PRTG Manual for a list of all available sensor types.

PRTG is compatible with all major vendors, products, and systems

compatible with all major vendors, products, and systems

PRTG makes availability monitoring as easy as it gets

Custom alerts and data visualization let you quickly identify and prevent network availability and performance issues.

Free download
PRODUCT OVERVIEW

”Adopting PRTG has been like going from being in the dark to being in the light. Before, we had limited visibility into what was happening in the infrastructure and in the network. Now, however, thanks to the comprehensive dashboard and real-time notifications, we receive constant updates on the status of facilities and services, and our way of working has gone from passive to proactive.”

Luca Meneghesso, Senior IT infrastructure and Security Specialist
Banca Profilo

”GESAC increasingly focuses on innovation to improve the quality of services offered and the experience of passengers handled every day by Naples Airport. Thanks to PRTG, we finally have unified, automatic, and continuous monitoring of the airport network and can guarantee quick and timely interventions.”

Domenico Ciervo, GESAC ICT Manager
Naples International Airport

”As an international company, PRTG is ideal for us. If something went down half way across the world, we wouldn’t be woken up – we can rely on PRTG to identify the problem and alert us before it occurs – enabling the right person, in the right time zone to resolve the problem. At the end of the day, if we’re to provide an internal network experience for our employees that meets expectations, we need a tool like PRTG to be successful.”

Barry Kelly, Systems Engineer
Skyscanner

“I would recommend PRTG because it has helped us significantly improve service uptime by highlighting important alerts that would otherwise result in a system failure or service disruption if action was not taken. Thanks to PRTG, we can ensure that The Ritz London’s network and IT systems are five-star, just like the hotel.”

Richard Isted, IT Manager
The Ritz London

Your availability monitor at a glance – even on the go

PRTG is set up in a matter of minutes and can be used on a wide variety of mobile devices.

device overview
Gartner peer insights

“Great interface, intuitive, full REST support. custom scripts, rest sensors add extra value. We have been using PRTG for 10 years now in multiple environments and use cases. it has by far the best interface and very easy to setup without prior experience.”

Read the complete review at Gartner Peer Insights

Create innovative solutions with Paessler’s IT partners

Partnering with innovative IT vendors, Paessler unleashes synergies to create
new and additional benefits for joined customers.

IP Fabric

IP Fabric

Combining PRTG’s broad monitoring feature set with IP Fabric’s automated network assurance creates a new level of network visibility and reliability.

Read more
Siemon

Siemon

Siemon and Paessler bring together intelligent building technology and advanced monitoring and make your vision of intelligent buildings and data centers become reality.

Read more
UVnetworks

UVnetworks

UVexplorer integrates tightly with PRTG to bring fast and accurate network discovery, detailed device inventory, and automatic network mapping to the PRTG platform.

Read more

Find the root cause of the problem with our PRTG availability monitoring solution

Real-time notifications mean faster troubleshooting so that you can act before more serious issues occur.

Free download
PRODUCT OVERVIEW
Paessler PRTG

Paessler PRTG

Network Monitoring Software – Version 24.4.102.1351 (November 12th, 2024)

Hosting icon

Hosting

Download for Windows and cloud-based version PRTG Hosted Monitor available

Languages icon

Languages

English, German, Spanish, French, Portuguese, Dutch, Russian, Japanese, and Simplified Chinese

test

Monitor everything

Network devices, bandwidth, servers, applications, virtual environments, remote systems, IoT, and more

test

Pricing

Choose the PRTG Network Monitor subscription that's best for you

Discover more monitoring insights and stories

Resources Solution

Solutions for all your monitoring needs

  • Server Availability Monitoring
  • Website Availability Monitoring
  • SLA monitoring & reporting
Resources Content

Powerful stories from the monitoring world

  • Monitoring availability and energy efficiency in data centers
  • Monitoring Certificates and Availability of Devices
  • Analyzing Starlink speed and availability over 10 months
Resources Solutions

Resources to master your monitoring challenges

  • Availability Report for multiple devices
  • Is there a way to monitor SSH availability for a Router?
  • Monitoring Availability of a VPN Service

Availability Monitoring: FAQ


What is availability monitoring?

Availability monitoring is the process of continuously observing and measuring the uptime and performance of a system, network, or service to ensure it remains accessible to users. This involves tracking metrics such as response times, downtime occurrences, and overall reliability. Availability monitoring plays a crucial role in maintaining service level agreements (SLAs) and meeting customer expectations for reliable access to digital resources.

Why is availability monitoring important?

Availability monitoring is important for several reasons:

  • Maximize uptime: It ensures that systems and services remain accessible to users without significant interruptions, which maximizes their availability and minimizes downtime.
  • Meet SLAs: Many organizations have service level agreements with customers or stakeholders that specify minimum levels of uptime and performance. Availability monitoring helps ensure these agreements are met or exceeded.
  • Identify and troubleshoot issues: By continuously monitoring availability metrics, organizations can quickly identify and resolve any issues or potential bottlenecks that may impact accessibility or performance.
  • Optimize user experience: Consistent availability and reliability contribute to a positive user experience. Monitoring helps maintain high levels of accessibility, which in turn leads to greater user satisfaction and loyalty.
  • Enhance business continuity: Availability monitoring is a key component of overall business continuity and resilience strategies. It helps organizations anticipate and mitigate potential disruptions, ensuring critical services remain operational even in the face of unforeseen events or challenges.
Can PRTG monitor more than availability?

Yes. PRTG is proprietary monitoring software that can monitor your entire IT infrastructure including network traffic, applications, bandwidth, cloud services, databases, virtual environments, availability & uptime, ports, IP addresses, hardware status, network security, web services, and much more.

How do I configure a high-availability cluster in PRTG?

With PRTG, setting up a simple failover cluster is quick and easy. Configure one PRTG server on two different computers, each with the same license key. Decide which of your PRTG servers is to be the master node in the cluster, and follow the steps in our how-to guide.

What is a sensor in PRTG?

In PRTG, “sensors” are the basic monitoring elements. One sensor usually monitors one measured value in your network, for example the traffic of a switch port, the CPU load of a server, or the free space on a disk drive. On average, you need about 5-10 sensors per device or one sensor per switch port.

We asked: would you recommend PRTG? Over 95% of our customers say yes!

Paessler conducted trials in over 600 IT departments worldwide to tune its network monitoring software closer to the needs of sysadmins. The result of the survey: over 95% of the participants would recommend PRTG – or already have.

recommendation

Still not convinced?

Love

More than 500,000 sysadmins love PRTG

Paessler PRTG is used by companies of all sizes. Sysadmins love PRTG because it makes their job a whole lot easier.

PRTG

Monitor your entire IT infrastructure

Bandwidth, servers, virtual environments, websites, VoIP services – PRTG keeps an eye on your entire network.

test

Try Paessler PRTG for free

Everyone has different monitoring needs. That’s why we let you try PRTG for free.

PRTG Logo

Start availability monitoring with PRTG and see how it can make your network more reliable and your job easier.

Free download
PRODUCT OVERVIEW

Products

  • Paessler PRTG
    Paessler PRTGMonitor your whole IT infrastructure
    • PRTG Network Monitor
    • PRTG Enterprise Monitor
    • PRTG Hosted Monitor
  • PRTG extensions
    Extensions for Paessler PRTGExtend your monitoring to a new level
  • Icon Features
    FeaturesExplore all monitoring features

Monitoring with PRTG

  • Network monitoring
  • Bandwidth monitoring
  • SNMP monitoring
  • Network mapping
  • Wi-Fi monitoring
  • Server monitoring
  • Network traffic analyzer
  • NetFlow monitoring
  • Syslog server

Useful Links

  • PRTG Manual
  • Knowledge Base
  • Customer Success Stories
  • About Paessler
  • Subscribe to newsletter
  • PRTG Support
  • PRTG Consulting

Contact

Paessler GmbH
Thurn-und-Taxis-Str. 14, 
90411 Nuremberg 
Germany

[email protected]

+49 911 93775-0

  • Contact us
©2025 Paessler GmbHTerms & ConditionsPrivacy PolicyImprintReport VulnerabilityDownload & InstallSitemap
SNMP Monitor SNMP Monitor SNMP Monitor